Sunday, December 26, 2021

Never so steady polar vortex circulation, strange things happen when nothing moves

 ~Take one day,  any day,  of the recent weeks,  and the weather image is close to the same.

~So much for chaotic weather

   First we observe winter 2021 Siberian Cold Temperature North Pole dominance,  a awe puzzling phenomena, which I have a somewhat good grasp,  but this is the main feature,  we start from there,  but was it always like this?


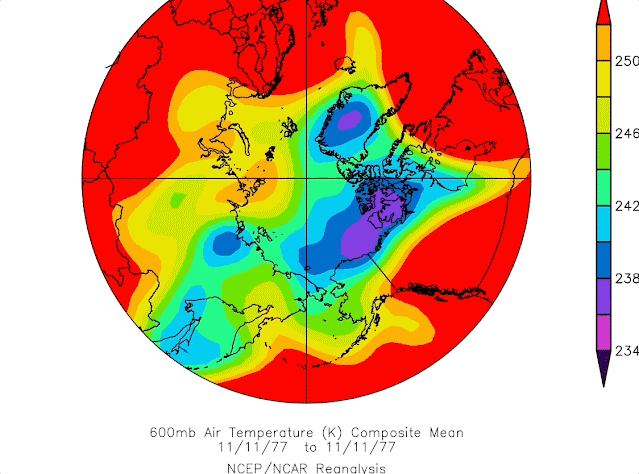
NO is the answer,  spot check 4 winter days in the not so distant past,  the year when Arctic sea ice was much thicker,  1977,  with Arctic sea ice wedged or ridged against the North American side of the North Pole helped create a colder region than Siberia.  Remember he Canadian Arctic Archipelago, prior to 1947 had very few people living there for a reason,  it was often colder than Siberia.   In this spot check, November 11, 25;  December 9 and 23 at 600 mb temperature, where the average temperature of the troposphere may be found without calculations.  3 out of 4 of these days,  the legendary bitter cold Siberia,  was warmer than the Canadian High Arctic. 


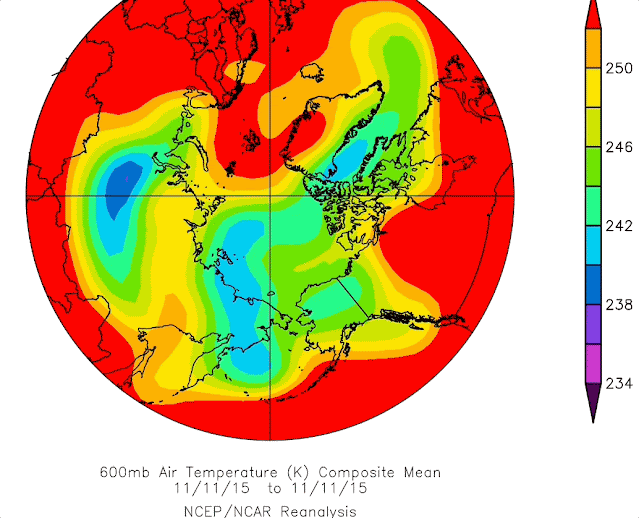
Fast forward 2015,  3 years after the famous 2012 Arctic Sea ice  minima melt,  there was the strongest El-Nino in history,   Siberia appears dominant cold 2 days out of 4,  yet ,  El-Nino was on the American side of the Pole, so this might be ENSO driven.  But recent years observations gradually place Siberia coldest atmosphere of the Northern world during the majority of winter days,  a shift,  largely due to the Northern Pacific and Atlantic being very warmed;


3 out of 4 same November and December days in 2021,  make Siberia the dominant Coldest Atmosphere ,  a huge pattern shift,  Ignore Greenland area,  the atmosphere at 600 mb is greatly influenced by ice, there should be dominance of cold air  at the top of a Glacier especially when 600 mb winds are calm, so a daily record must consider this.   Besides it rained at the top of Greenland this summer past:

 https://www.nbcnews.com/science/environment/rained-first-time-summit-greenlands-ice-sheet-rcna1723    

    Weather wise it has been weird, stranger than usual Global Warming induced changes,  the apparent stability of 2021 patterns have been uncanny,  gave results positive of nicer milder much warmer weather in Eastern North America,  and devastating floods in usually very weather quiet British Columbia.  Contrast the 1977 outline of 252 degrees Kelvin and the 2021,  same days,  weather systems flow around this limit,  which greatly explains why B.C. got a greater injection of extremely warmed North Pacific air.   


Sunday, November 21, 2021

Prelude to the Late Great Arctic Ocean summer sea ice, the writing is in the air

 ~There is a minimal,  but valuable,  effort to measure Arctic sea ice in its 3d nature

~It is about to vanish in summer,  this is one way to  know it:


  October November Canadian Arctic Archipelago Upper air profiles have evolved.  They are more like Southern Canadian ones.  The main reason is the disappearance of sea ice,  mainly now in its thickness.  This allows heat from the even warmer ocean to transform the lower troposphere.  In effect cancelling the build up of winter to a lesser degree of magnitude.  The difference between tropopause temperature and tropospheric maxima has grown,  the tropopause is usually much higher,  the inversion heights from surface have dropped.  But in particular temperature profile maxima to surface lapse rate has shrunken significantly since 2019, indicating a massive warming, therefore thinning of sea ice,  no longer thick enough similar in nature to deep frozen land.   It would take a much larger intense study to confirm how wide scale this phenomena is,  it would take a huge recalculation of historical measurements particular data points from all stations, not readily available on internet, in order to pinpoint exactly when the Arctic summer sea ice will completely melt.  Assessing atmospheric measurements far more rich in data, would make it easier to predict,  the keen  Arctic Atmosphere mirroring current Arctic sea ice state, is a work around way to measure over all sea ice thickness,  but seems it wont be long before it will all gone.  When the High Arctic Upper Air becomes close to resemble the subArctic of the 80's (its warming there as well) , ie Hudson Bay for instance,  we will have a better idea.  WD November 21 2021


Sunday, November 14, 2021

October 2021 total collapse of Canadian Arctic Archipelago cold air build up, never before observed

~Never recorded as such ,  incredible High Arctic warming goes irresponsibly unreported,  although its climate effects will surely be talked about.


IGNORE Greenland,  925 mb air temperature does not exist inside a massive 600 mb high Glacier.   Look at the blue 262 Kelvin  (-21 C) reading especially over the Canadian Arctic Archipelago,  October 2021 gone, despite 2016 ultra warm El-Nino and the much thinner sea ice since 2012,   This will surely make an impression over North American weather further South.  Not that it wont cool,  but the colder sting of dark winter will start very late, if noticed at all.  

Surface air temperatures are again non existent inside Greenland Glacier,  Look at the massive surface cooling effect of thicker sea ice in 1977.  Now thinner,  Arctic Ocean sea ice influence is in steep decline,  no longer builds a more round circumpolar vortex.  These irregular Arctic average temperature shapes are reflected everywhere further South,  thus the wild winter temperature fluctuations of late.WD November 14 2021

Sunday, November 7, 2021

The Polar Vortex Fix; Near permanent Siberian dominance, especially over ENSO's influence

 ~Coming winter will likely be a warm one for North America

~Notwithstanding ENSO apparent LaNina?   

~As far as circulation is concerned the Polar Vortex rules the world

Take nearly any day in October just past and the vortex would look like above,  of which Northern Siberia was/is at the Cold Temperature North Pole (CTNP).  Northern Greenland and Ellesmere Island mostly strangely out of extreme cooling business.  Largely because of North Pacific incoming warm cyclones driven towards West Greenland by the same Polar Vortex,  a feedback loop.    If the extreme Southern location of the P.V. is way up in the High Arctic,  it goes without saying about the warmer weather further all the way South to Florida  

   Here is one Canadian Global News long range winter forecast ,  a fairly descent, standard, run of the mill projection about the coming winter, ENSO dominates the talk,  but the Polar Vortex does the walk...


     The NYTimes did a state of the comprehension, quite good piece on ENSO,  however it almost triggered the writer, Henry Fountain,  to look for circulation pattern causations elsewhere:


......"The changes in atmospheric circulation can result in changes in weather in various parts of the world, what meteorologists call teleconnections. Much of this is related to the position of the jet stream, the high altitude winds that sweep across the planet from west to east.

In El Niño, the jet stream tends to shift to the south. That can bring rainier, cooler conditions to much of the Southern United States, and warmer conditions to parts of the North. Elsewhere, El Niño can create warm, dry conditions in Asia, Australia and the Indian subcontinent. Parts of Africa and South America can be affected as well.

In La Niña, the jet stream shifts northward. That can lead to warm and dry conditions in the Southern United States, and cooler, wetter weather in parts of the North, especially the Pacific Northwest. Parts of Australia and Asia can be wetter than normal.

La Niña can also lead to more hurricanes in the North Atlantic because there is typically less wind shear, the changes in wind speed and direction that can disrupt the structure of cyclonic storms as they form.

It’s important to note that these are just typical effects. El Niño and La Niña sometimes don’t follow the expected patterns.
" (underline by me)

What is more to the point is that El-Nino and El-Nina don't appear to change circulation patterns pretty much already set by winter, or can you tell which of these jet stream average positions between January 1 and April 10 happened during El-Nino or La-Nina? :

   2 were El-Nino , 2016 and 19, two others under La-Nina 2000 and 08.

   Finally recall the forecast presentation ? There is too much certitude over the coming La-Nina, since 2016 ENSO temperatures tended to remain in the neutral temperature zone or at temperatures considered neutral, this was its main routine of late, briefly trending one way or the other never going too extreme. A week or so a La-Nina forecast was in the bag but now:

Not so blue cold.... wd Nov 7, 2021

Sunday, October 31, 2021

2012 Great sea ice melt retrospective, it was predictable in April

~A refraction magic rabbit (a new way of seeing things,  to be published in peer review paper), popped out of the hat in early spring 2012.  

~It turns out a very warm spring atmosphere made it possible

~Comparison of top 10 sea ice extent melt follows:


Before we do top 10 sea ice melts,  let's look at 2012 vs 1977.  2011 sea ice situation was grim,  1976 was opposite, much more multiyear sea ice was covering the entire Arctic Ocean.  This made it easy for the Polar Vortex to be North Pole centric then.  Notice the green zone -30 C temperature area at 600 mb height (those favoring 500 mb can be greatly confused by stratospheric influences).    2012 was exceptionally warm for the Canadian High Arctic (so did say the rabbit).  

                        Likely #11,  2021
What happened in 2021?     After all 2020 was 2nd place in sea ice extent.  The vortex regained the Pole,
this guarantied a great influx of clouds from the North Pacific sea surface temperature '"hot" blob,  in addition to accelerating importation of moisture by equally super warm North Atlantic, summer Arctic clouds save ice from melting completely hence the appearance of a cold air recovery.

8th Place, 2008 the LaNina Spring super sunshine melt ponds


   2008 vs 2012  LaNina was raging in 08 giving a reduction of clouds ,  causing more insulation, but starting from a much colder spring atmosphere. 

   In 7th position:
Spring 2011 was almost bipolar for the Polar vortex, the Canadian Archipelago very strong vortice of the Polar Vortex assured 2 things,  dry air from North Greenland towards the Pole and the wet North Pacific moisture trust directly towards the North Atlantic,  in imagery words,  apt for good solar input for the Arctic Ocean,  
#6  2015 the warmest year in history then
The waning -30 C green zone plus the Baffin Bay centric center of the Polar Vortex,  similar to 2011,  assured 2015 prominence in melting.
#5   The sun melt year: 2007
2007 600 mb  spring temperature was practically similar to 2012 the area having the greatest melting by sunshine was North of Alaska Beaufort sea  we can see clearly a favorable North Siberian in provenance circulation of dry air. 
  #4  super ENSO warming; 2016 
2016  green -30 zone shrank to near 2012 dimensions along with a stifling encroachment of red (-24 C) areas all throughout the Arctic ,  again favoring dry air from Siberia sun warming.


3rd sea ice melt place; The great small but very cold CAA Vortex 

2019 may seem much colder than 2012,  however North Atlantic and Pacific had a very warm spring atmosphere.  Again key,  dragging dry Siberian air over Alaska and Eastwards,   The Canadian Arctic Archipelago vortice was measured stubbornly in place for the longest time assuring these dry (less cloudy ) air conditions. 

2nd only to 2012:  2020
The second most powerful sea ice extent melt had no blue zone (-33 C) similar to 2016,  we can also note the heat strangling cold areas red zone, particularly South Greenland Baffin Bay,  but in particular the position of the polar vortex center,  North Pole centric,  not because there was thicker sea ice there , but because it was coldest there.    A stable warm area encourages a stable cold center which was the Pole. Also noteworthy; North Alaska air being warm after the long dark season seems to assure a forthcoming great melt

    All in all we can now project with a greater deal of precision whether the sea ice minima will be small by mid-April,  another prediction tool thanks to said "rabbit" refraction trick which suggested looking at these holistic temperatures.  WD October 30 2021

Tuesday, October 26, 2021

Cloudy days heat transfers, 3d sea ice transforms, a different perspective about 2021 summer sea ice melt

   October 6 2021 arrival of Arctic Ocean multi-year pack   completely flattened,  thin,   not changing sea water temperature a great deal,  not stimulating new ice to form.  Of which sea water temperatures were abnormally warm,  despite said presence of pack ice. Open water above 0 C temperatures of end of September rivaled 2012 same date measurements.  

~It is important to consider sea ice extent in all its dimensions.  Not just compare the horizontal one.

~Whereas a penetrating 2007 or 2012 sunlight melt didn't occur,  there was a great loss of ice nevertheless

~The proof is in the size of multi year pack ice,  usually seen floating away from the Arctic Basin looking like a mix of first year and much older ice with various height profiles,  giving the impression of a spectacular jungle of sea ice vertical shapes, 2021 had no such great old tall forms to observe.  

  Surface temperatures October 2021 are the warmest the Canadian archipelago had in history,  despite 11th place finish of Arctic sea ice extent at minima.  The disconnect between the two suggests a much warmer sea,  spreading around heat more evenly,  even under a huge area of intense cloud cover lasting months, with very little insolation to speak of. 


2021 October 26 (left) and 25 frost and drizzle accretion,  South Cornwallis Island (-1 C weather).    With end of October 16 C above normal,  almost everyday was at record or is a record maximum temperature for the entire month!


      October 6 sea ice arrival,  speaks for self,  especially for those who are use to seeing fall ice movements. WD October 26, 2021


Friday, October 22, 2021

2021 sea ice minima story, it was bad, despite what the numbers suggest.

 ~Hi,  nice to be back after a little break

~ I did not expect 2021 Arctic sea ice minima to be greatly shattering 2012 record because of North Pacific in origin clouds.

~Summer 2021 clouds were even more extensive than expected since even the Atlantic sea surface temperatures were extremely warm as well.

~ With these overheating North seas,  there was no way for an expansive prolonged  sea ice exposure to summer sunshine. 

~Yet this was a terrible year for sea ice nevertheless,  despite 11th place historical finish,  the remainder ice seen streaming through Arctic Archipelago Straits were never observed so thinned, demolished, emaciated and flattened.  

2021 sea ice minima was a good 1.4 million square kilometers shy of 2012,  failing 2020 2nd place as well.   But there is a difference between these years,  and it was cloud pervasiveness,  which persisted and continues till this day going back to June.  There is also quite compelling piece of evidence of sea ice extent being near all time lowest at present, in summary:  no recovery at all is at play,  rather a form of heat embedding through different means.  Clouds during Arctic summer make it cooler,  but come fall if continued,  flip autumn temperatures much warmer:

NOAA 30 day surface temperature anomaly says it all,  the Canadian Archipelago average temperatures are hovering between 10 to 20 C above normal.  This does not stem from much more minima sea ice,  but from a warmer Arctic Ocean which has not melted completely because of extensive cloud cover, end of summer clouds saved the ice but did not foster rather stymied a cooling rebound.  

   Extra wide areas of extreme warm sst's for both North Atlantic and Pacific are the prime source of world wide heat injections particularly by water vapor,  a potent greenhouse gas,  which adds to the others us humans tend to dump in the air.  

   Next reports will cover the emaciated looks of surviving multi year ice,  why Siberia is now the last refuge of winter buildup and a retrospective of 2012 minima, which was baked in the spring well before summer solstice sun.  wd October 21 2021


Sunday, June 6, 2021

AFTER Switchover sea ice doomed by warm Highs

 ~Reminiscent of 2007,  any anticyclone lingering over the Arctic Ocean means rapid melting

~Remarkable weighted temperature differences between Low and High pressures are already in place

CMC June 6 2021 700 mb,  close enough to 600 mb ,  temperatures within all Arctic Lows are significantly colder than at centre of anticyclones, of which a remnant of the once persistent High over the basin Gyre is hanging on.  But the switchover id definitely done,  disrupting the transpolar ice stream,  
NASA EOSDIS May 31 June 6 2021,  one should not underestimate this smaller High pressure,  either
for melting or moving sea ice.  If the High remained over the Arctic Gyre,  it would have been even more devastating,  circa 2007.     Notwithstanding clouds,  an enormous amount of open water occurred in the Beaufort sea area in a few days,  very early in the melt season,  thinner sea ice,  likely present at extent maxima, has no chance to  last long against the sun.  Note the rapid melting of snow Northern Yukon and NWT with mainly lake ice remaining. WD June 7 2021 


Sunday, May 30, 2021

Spring 2021 switchover , transpolar drift staller

 ~Most likely occurring today.

~But not after a great sustained Arctic Basin Gyre did its thing.


 A typically strong Arctic transpolar stream  is pushing out sea ice in great volumes,  but the results are not quite showing since North Atlantic melting has begun.  ITP map

May 30 polar View  SAR shows the exit of old sea (right) pushed by thinner sea ice (top left) which will settle most likely North of Greenland soon,  and there will be great open water  there.  

   It will settle because: 

     CMC prog,  18 UTC may 29, followed by 00-06-12-18 UTC May 31.  Look in particular for the High over Northern Quebec and Atlantic, plus the Low pressure system NW of the Canadian Arctic Archipelago,   this Low already stubbornly present, will persist to affect the sea ice current in favor of saving the sea ice from landing in warm Atlantic waters.  But all the ice dumped to Fram Strait , East of Greenland will melt,  its sort of deja vu dynamics going back a few recent years.  The 2nd smallest minima in history, last September,  gave a lot of new sea ice, melting in place thinner sea ice depends on clear skies, which will happen pretty much everywhere outside of a hovering Low pressure system.
But if 24 hour sunny,  with cleanest air in decades,  which explains the current melting tardiness, melting will be very swift.  WD May 30, 2021


Sunday, May 23, 2021

Summer Threshold switchover, when High's become warm and Low's are sustained by cooler air

 ~It is just about to happen,   after long sojourning Arctic Basin High pressure system  

~Impacts sea ice survival in a big way

    The reasons why cyclones persist more in cooler summer weather are obvious,  they cast a shade from the sun.  In the Arctic it is a bit more complex,  sea ice helps create clouds as well,  more of it causes a cloudier Polar summer. Moist air hitting an ice pack easily fogs up,  fog is a cloud touching the surface.   Onto itself summer sea ice and cyclones are a pair,  so it is not surprising that summer Lows tend to survive longer above ice. But there is a time,  such as now,  when cold Highs and Lows may subsist simultaneously:


  3 CMC surface progs, 23 May 00 UTC,  23/06 and 23/12 UTC +extra 700 mb 23/12 UTC.  All showing a less imposing Arctic Gyre High,  apparently moving towards the Canadian Arctic Archipelago where it will eventually be just South of it,  and a 1008 mb Low over the Arctic Ocean Gyre.   Where it will stymie the sea ice exodus towards Fram Strait,  just Northeast of Greenland.   The 700 mb chart portrays this High and Low as having about the same temperature,  this anticyclone will warm a lot,  because it is allows sunrays through,  opposite to the Low, basking in cold, sustained by sea ice,  cloudy weather.  The split in behaviors is temporal in nature and will revert back opposite coming September.  Clouds are essentially all there is stopping a massive catastrophic sea ice melt.  But this is a "frustrated" but nevertheless end of La-Nina weather cycle,  meaning over all lesser clouds and especially warmer High's significantly warmer by lesser pollution at end of Covid pandemic.   WD May 23, 2021