Sunday, March 26, 2017

Consequential applications #2, where is sea ice melting today?

~                                           Ts=Ttsi

       When the mean daily surface temperature is equal to the mean daily top of sea ice temperature,
net melting is occurring.


NOAA daily composites March 23 2017. Skin temperature (left) surface air temperature (right). Barents sea area,  vicinity Franz Josef lands Russia,  there is a band where Ts=Ttsi ,  or Ttsi is a bit warmer than surface temperature,  I usually would consider this as within margin of error from Satellite acquisition, I consider the mean  Ttsi= Ts there.   


Skin temperature areas marked in black where the likely melting is occurring.  


JAXA map,  2 days later,  March 25 2017.  Shows indeed melting where Ts=Ttsi

WD March 26, 2017


Consequential applications gained from the First Rule of Sea Ice Horizon Refraction

~Far from  exotic "interesting mirages" ,  the first rule of sea ice refraction theorized from multiple horizon observations gives many key climate applications.

~                                                      Ts>=Ttsi
              implies a warming sea ice surface automatically gives warmer surface air.

~ The very reason for winter Arctic surface based inversions  can only last till
sun rays become vertical enough to cancel them at the source,  the "skin" surface.

   1987's  spring was very cold,  it was well pre 1998 onwards steeper summer demise of  Arctic sea ice volume and extent.


We notice NOAA ESRL "surface skin" temperatures with same color scales Mean Composite March 1 to 15 1987 followed by 2017.   The first deep signal gathered here is how massively colder Arctic Ocean ice pack was in 1987,  nearly all of the Arctic Ocean in deep purple, with 238 Kelvin at the Pole,  246 degrees  Kelvin at its periphery.  Note the red zone North of Atlantic ocean,  warmer than 264 kelvin,  this is the only common mean temperature with these 2 periods 30 years apart.  2017 has geographically much warmer skin temperatures,  reflecting the thinner sea  ice locations.


 Since the prime refraction rule posits surface air temperature always warmer than "skin temperature"
the surface air from 1987 to 2017 warmed proportionally while always warmer than sea ice ,  again only the extreme North Atlantic has had similar temperatures between 1987 and 2017.   Since 1987 same period interval,  the North Pole area warmed  14 to 20 C exactly where the thinner ice is today.

     The key source of this rule is at top of ice or snow skin,  its temperature follows the surface air temperature trends.   Top of thinner sea ice is much warmer than thick sea ice.  Therefore the air has warmed along with the advent of thinner sea ice by substantial average margins.  This absolutely implies a current much thinner near North Pole sea ice pack,  while very thick multiyear ice North of Ellesmere and adjoining Islands are now the last remnants of a once much thicker Polar ocean pack spread out all the way to Russia.
 
      Like a mirror,  top of sea ice temperatures varies with surface air in tandem,  if ice becomes warmer so does the air, the top skin is always cooler for rather simple and complex reasons,  to be explained on another essay.  Only solar forcing,  an external input of energy,  with especially higher elevation sun rays,  warm the top of ice/snow to render sea ice to air interface isothermal. However,  now you can study indirectly where the thinner ice is with mere temperature maps because of the relation between top of ice and surface air deduced from the prime refraction rule.  WD March 26,2017


Monday, March 20, 2017

First rule of sea ice horizon refraction proven.

~Ts>=Ttsi,  Surface temperature is always greater or equal than top of sea ice temperature
~ Recommendation for buoy thermistors:  measure in the shade
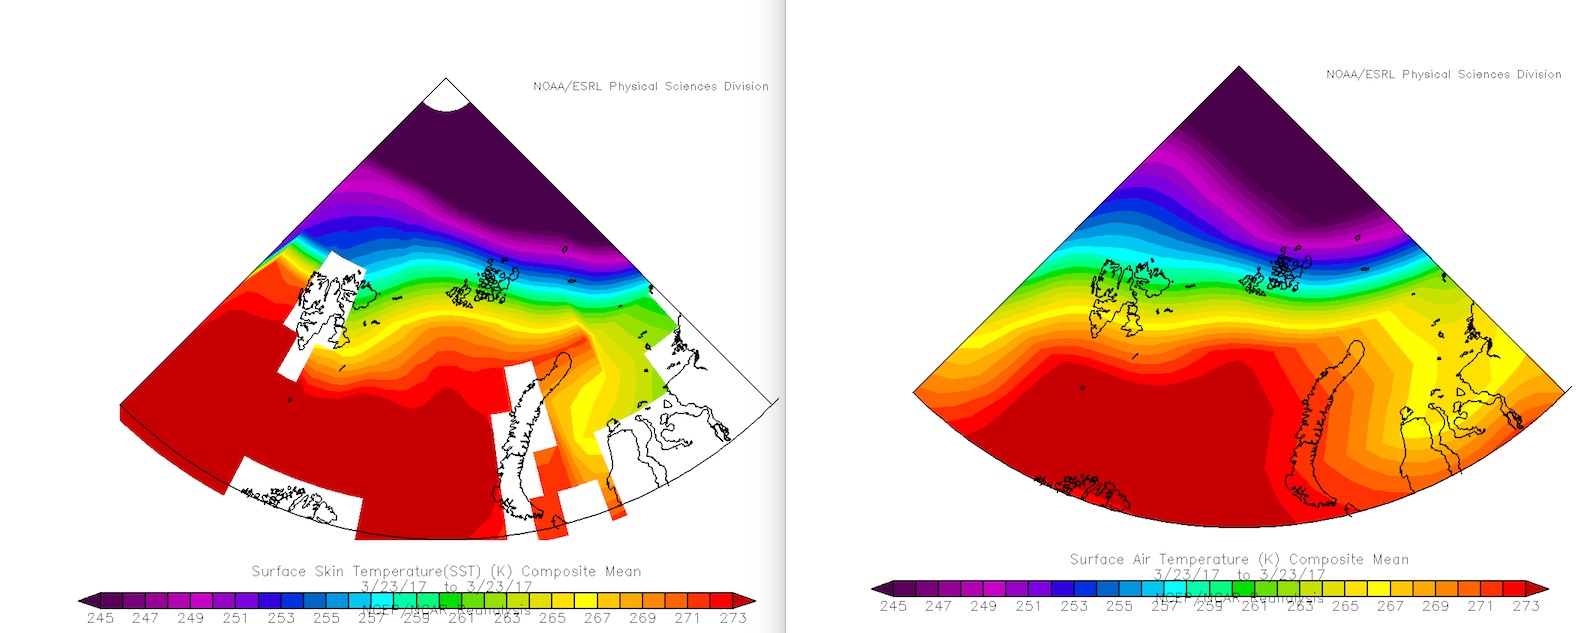
~ This rule is useful for calibrating remote sensing skin temperatures
~ Top of snow layer is coldest day or night,  cloudy or sunny

   One of the greatest features observed at the sea ice horizon is seen when the Astronomical Horizon is reached,  this doesn't happen at any other time then when the air above it is isothermal.  Above sea ice air can't be isothermal without downward solar flux equal or greater to the upward.  This horizon altitude is only attained mainly in the Spring when solar radiation cancels the cooling done by top of sea ice deeply frozen over the long Polar winter.   During the long Arctic Night,  the Astronomical Horizon was never observed,  the horizon always was above A.H...

Link here

http://eh2r.blogspot.ca/2015/05/dedicated-sea-ice-model-proofing.html

   for the first formal hypothesis in May 2015,   which included the first ever Sea Horizon Evolution sketch given the various seasonal temperature profiles:

   Sea ice in green becomes dominant in winter,  but only in spring can we observe the Astronomical
Horizon (in orange) coinciding with the horizon (in black horizontal line associated with the temperature profile).   Prior to that,   another very important feature dominates:   top of sea ice  is always colder than surface air.     This gives a near permanent high horizon height,  till the sun warms top of ice and in turn warms the air immediately above,  then as the sun gradually rises higher day by day the horizon finally drops to A.H.  But this higher than A.H.  period needed data.

    On one occasion I used Arctic sea ice buoys during the dark season to prove this optical rule in April 2016:

http://eh2r.blogspot.ca/2016/04/sea-ice-refraction-prime-rule-top-of_28.html

      During the dark season,  top of buoy thermistors were always colder  than surface air.
Then we needed further in situ observations:


Nice sunny High Arctic day, in the snow drift shade atop a 1 meter high snow column density .36,  the temperature of the top of snow was -32.3.
measured with a high precision Omega monitor attached to  very sensitive Thermistor rated +-0.1 C.  
A few meters away , the ventilated 2 meter surface temperature was -30.2 .


 In the sun above or below snow ,  the thermistor warms rapidly to -29.3 in a few seconds.

Still outside ,  1 minute later the thermistor keeps on warming to well above -27 C.  The sun affects the thermistor greatly. Just like sea ice buoy thermistors embedded in snow.

   Top of snow column being about 1 meter above ground,  mid way down sideways,  a shade reading is stable at -26.7 C.  Like sea ice, the ground was warmer.
10 cm above ground the snow column is even warmer,  again in the shade,  -25.7 C.  This is a sea ice proxy.  The ground was warmer than the air....

     After several days of data,  it doesn't matter whether it is sunny or cloudy,  day or night or whether the temperature trends warmer or colder,  the temperature of top of snow column in the shade (or during evening) was always colder than the surface air.   Thus proving the first rule of sea ice horizon refraction.   I await warmer days.

  And now for top of sea ice measurements:

Day after,  March 21 2017,  outside temperature  was -28 to -29 C above sea ice with no 2 meter high ventilated surface reading,  the picture above is snow over sea ice temperature measured within a snow drift shade, -30.2 C.    By the ventilated screen, 3 kilometers away 46 meters ASL,  outside temperature was -30 C with top of snow -34 C (in the shade).  Sea ice surface here was about 40  cm below.   Top of sea ice snow was 4 degrees warmer than top of land snow.   This helps explain why the coldest Arctic air formations usually occur over land and or in the not so distant past,  over very thick sea ice. 

Right by thermistor in the sun.  As warm as -26.8 C.

     Direct vertical probing,  -25.3 C in the shade,  a few centimeters below the surface layer,  sea ice snow was warmer than land snow.
Right by vertical probe hole,  snow skin subdermal was -30.4 C,  colder than surface air and the snow column just below it,  there may be lateral light scattering affecting the deeper reading.  

     A small tide crack,  2 meters deep,  sensor is about 30 cm from surface in open air,  the temperature was -20.8 C.   These openings are very common over the Arctic Ocean,  the heat injection they give should be quite huge since there are hundreds of thousands such openings.

   The first rule of sea ice horizon refraction is well confirmed by this model/ sat observations,  basically suggests that NOAA/ESRL needs refining especially near coastal sea ice areas,  this anomaly looks the same since last time I checked:

http://eh2r.blogspot.ca/2016/05/remote-sensing-vs-refraction-prime-sea.html


WD March 21-22 2017.


Monday, March 13, 2017

Rogue Polar vortices, one meets a Cyclone and closes down the Northeast Coast of North America

~NWWO strikes again,  leaves a last taste of wild temperature variations.
~ A rogue vortex came from afar


      We pay attention to coming storm named Stella which will cause havoc,  first it is primarily a coastal Cyclone heading  Northeastwards along the USA coast:

https://www.wunderground.com/blog/JeffMasters/all-eyes-on-east-coast-as-big-snowmaker-looms-for-tuesday

     But it meets an "Upper level Low"  as skillfully described by Dr Masters.  But this Low,  a vortex,  born from an offshoot of a massive but short lived cold spell from Central Ellesmere Island at about March 8,  when surface temperatures were more or less unusually normal for this time of the year.  As we follow its progress with 700 mb upper air temperatures,  we can see the gradual meanderings of the coldest air in the Northern Hemisphere,  a spin off vortex,  eventually ended up centered near Montreal.  But tonight the Ellesmere origin of this has warmed 17 C,  leaving vortices in its waning vanishing coldness.  The size and or variations gyrations of the coldest air zones,  quite smaller than usual, marked this winters outlook significantly,  favoring a continuous incursion of Pacific and Atlantic Cyclones to shield the Arctic Ocean from the normal long night lost of heat to space, there is always still a great chance for severe cooling given a lack of clouds by Anticyclones,  this is how great Northern Hemisphere winters were made, but the winter factory shrunk.   WD March 13, 2017

Friday, March 3, 2017

Varying thermal fluxes as portrayed by sea ice horizons.

~A few examples.
~Clouds help discern 2 distinct albedo reactions.

  At stake is this graph done by very capable mathematician Tamino,  essentially portraying total sky albedos given various weather possibilities:

   At latitude 75 degrees North we will deal with zenith angles  70 to 90 degrees.  Essentially the 2
blue lines.   Knowing Tamino's thorough laser dedication to exactitude,  this graph likely represents the standard  widely used Albedo reference numbers.   Note the "clear sky over bright sea ice"  vs "cloud over bright sea ice"  small 10% difference.  We deal here with these 2 features.  Keep in mind the actual horizontal view largely contradicts this.  If there is albedo reflecting clouds at Local Apparent Noon, the horizon view is dramatically different than with "clear sky albedo" consistently and repeatedly,  incoming sun rays become very deflected,  leaving a dramatic difference in horizon heights, either at Local Apparent Noon  or especially seen easier later as the sun lowers to the horizon.  A complete cloud cover  leaves the horizon altitude in a steady state of flux, as opposed to "clear sky albedo"  which enables the observer to witness various thermal effects un-impeded.  This implies that back radiation from bottom of clouds leave sea ice in neither extremes of cooling or warming.  Therefore heat which could be gained from direct sunshine is lost.  During the dark Arctic long night, clouds do just the opposite,  a lot of heat is not lost to space,  while during the long Arctic midnight sun days, persistent strong albedo clouds prevent a great deal of melting.

      The integrated albedos (graph above) perspective may be an erroneous concept.  Albedo layers  should  be calculated individually layer by layer following the sun ray path.  The idea of merging albedo layers is good, but 50% seems too low given the greater cloud cover when sea ice cools the warming summer surface.

   During the Arctic sea ice melt season there can be up to 4 stratocumulus decks stacked on top of each other.  It is the most common Arctic cloud,  with small water droplets 10 micrometers in diameter, there is also often wide ranging fog banks becoming stratus and reverting back to fog in long lasting cycles. Summer time viewing of sea ice from the vantage point of High Resolution satellite pictures is almost always a tasking job:

"Cloud albedo varies from less than 10% to more than 90% and depends on drop sizes, liquid water or ice content, thickness of the cloud, and the sun's zenith angle. The smaller the drops and the greater the liquid water content, the greater the cloud albedo, if all other factors are the same.

Low, thick clouds (such as stratocumulus) primarily reflect incoming solar radiation, causing it to have a high albedo, whereas high, thin clouds (such as Cirrus) tend to transmit it to the surface but then trap outgoing infrared radiation, causing it to have low albedo. It contributes to the greenhouse effect.[1][2]" wikipedia


       The presence of extensive multi layered cloud spreads,  often covering the entire Arctic Ocean for weeks, certainly brings up the cloud albedo value well above the 50% mark.  On occasions,  such as during summer 2007,   with persistent anticyclones, next to land and moving northwards,  shatter clouds important ice protective vail,  plummeting the ice pack to melt rapidly.  

    One primary reference for 50% integrated albedo was the Sheba project,  although the vanishing albedo is correct interpretation of latest melt trends, the nature of sea ice albedo is less variable than cloud cover. 

An annual cycle of Arctic surface cloud forcing at SHEBA , JOURNAL OF GEOPHYSICAL RESEARCH: SUBMITTED JANUARY 19, 2001 

   Sheba Albedo graph has been cited in other journals namely:  http://www.pnas.org/content/111/9/3322.full

   While the data proved interesting,  the said research ship location in summer 1998, Beaufort Chukchi seas, which by coincidence marked the beginning of the greater melting summers to come: 

       The open water footprint amongst sea ice at minima in 1998 suggests there was a great deal of insolation leaving mostly atmospheric absorption and sea ice albedo to reduce the melt otherwise with the full force of nearly direct sunlight and of course lesser total albedo.   

Calculation using separate step by step not integrated albedos:

Entire Arctic ice melt calculation using best albedo data available separately,  suggests a correct interpretation of the physics,  in a simple equation I call ASIMP,  Arctic Sea Ice Melt Potential

   ASIMP = Area of entire Arctic Ocean X TOA TSI  for Arctic Ocean  6 months from spring equinox to fall equinox X average summer sea ice albedo X Atmospheric Absorption factor X Average cloud albedo  / sea ice latent heat of fusion.

Using 

Arctic Ocean sea ice area:  14E6 km2 
Top Of Atmosphere average TSI for same area for Equinox to Equinox 70 to 90 N=  257 247 W/m2
  (equinox calculation closely matching known TSI graph median)
Clear Sky Albedo (sea ice albedo) =  50%
Atmospheric Absorption = 23%
Average cloud albedo over the summer = 80 % 
(1) Sea ice latent heat of fusion =   2.95e17 j/km3   U.N. fisheries and agriculture department
  (with density 0.89 t/m3 U.N, 1% salinity at -2 C according to Doctor Ono's chart)

     Gives ASIMP = 15,081 km3 (calculated mar 7, 2017) close to the actual POMAS latest summer melt 17,500 km3.   (77% cloud albedo is needed to make  ASIMP equal to 2016 summer melt). These variables were at first taken from different sources, I did not try to fit with known melts,  and they need be perfected, leaving the greatest yearly variation to cloud albedo.    This reformulation calculation gives a fairly interesting estimate.  

----------Arctic "clear sky albedo" vs cloud albedo effects:

   Series pictures displaying different sky conditions and resulting thermal flux action at the sea ice horizon.  If horizon outgoing thermal heat is equal to incoming Astronomical Horizon is achieved.
All pictures mostly above A.H. indicating net thermal loss from the sea,  those at A.H.  will be indicated.   None can be below A.H,.

   On all pictures,  top left:  date time, top right:  general sky condition,  lower left: temperature wind speed with narration, lower right: sea ice horizon elevation (2.6' is astronomical horizon) below is sun elevation in degrees.

     Dominant  Low cloud albedo

     Clear Air Albedo

     Arctic Ice Fog

   Mixed albedos , warmed sea ice

   Clear sky , warmed sea ice

    Clear sky albedo, sea ice "wall"  , maximum horizon height boosts, large diurnal thermal variations

     Clear sky albedo

   Horizon low clouds,  mixed albedo, clear at camera, cloudy away above sun beam path

    Clear sky albedo with some distant mid day dissipating later ice fog 

   Clear sky albedo , mid day distant ice fog and clouds

Mostly cloud albedo with light snow

Clear sky albedo,  all sea ice albedo.  

Clear sky albedo, all sea ice albedo

Early fog then cloudy albedo
 More to come...