~Take one day, any day, of the recent weeks, and the weather image is close to the same.
~So much for chaotic weather
First we observe winter 2021 Siberian Cold Temperature North Pole dominance, a awe puzzling phenomena, which I have a somewhat good grasp, but this is the main feature, we start from there, but was it always like this?
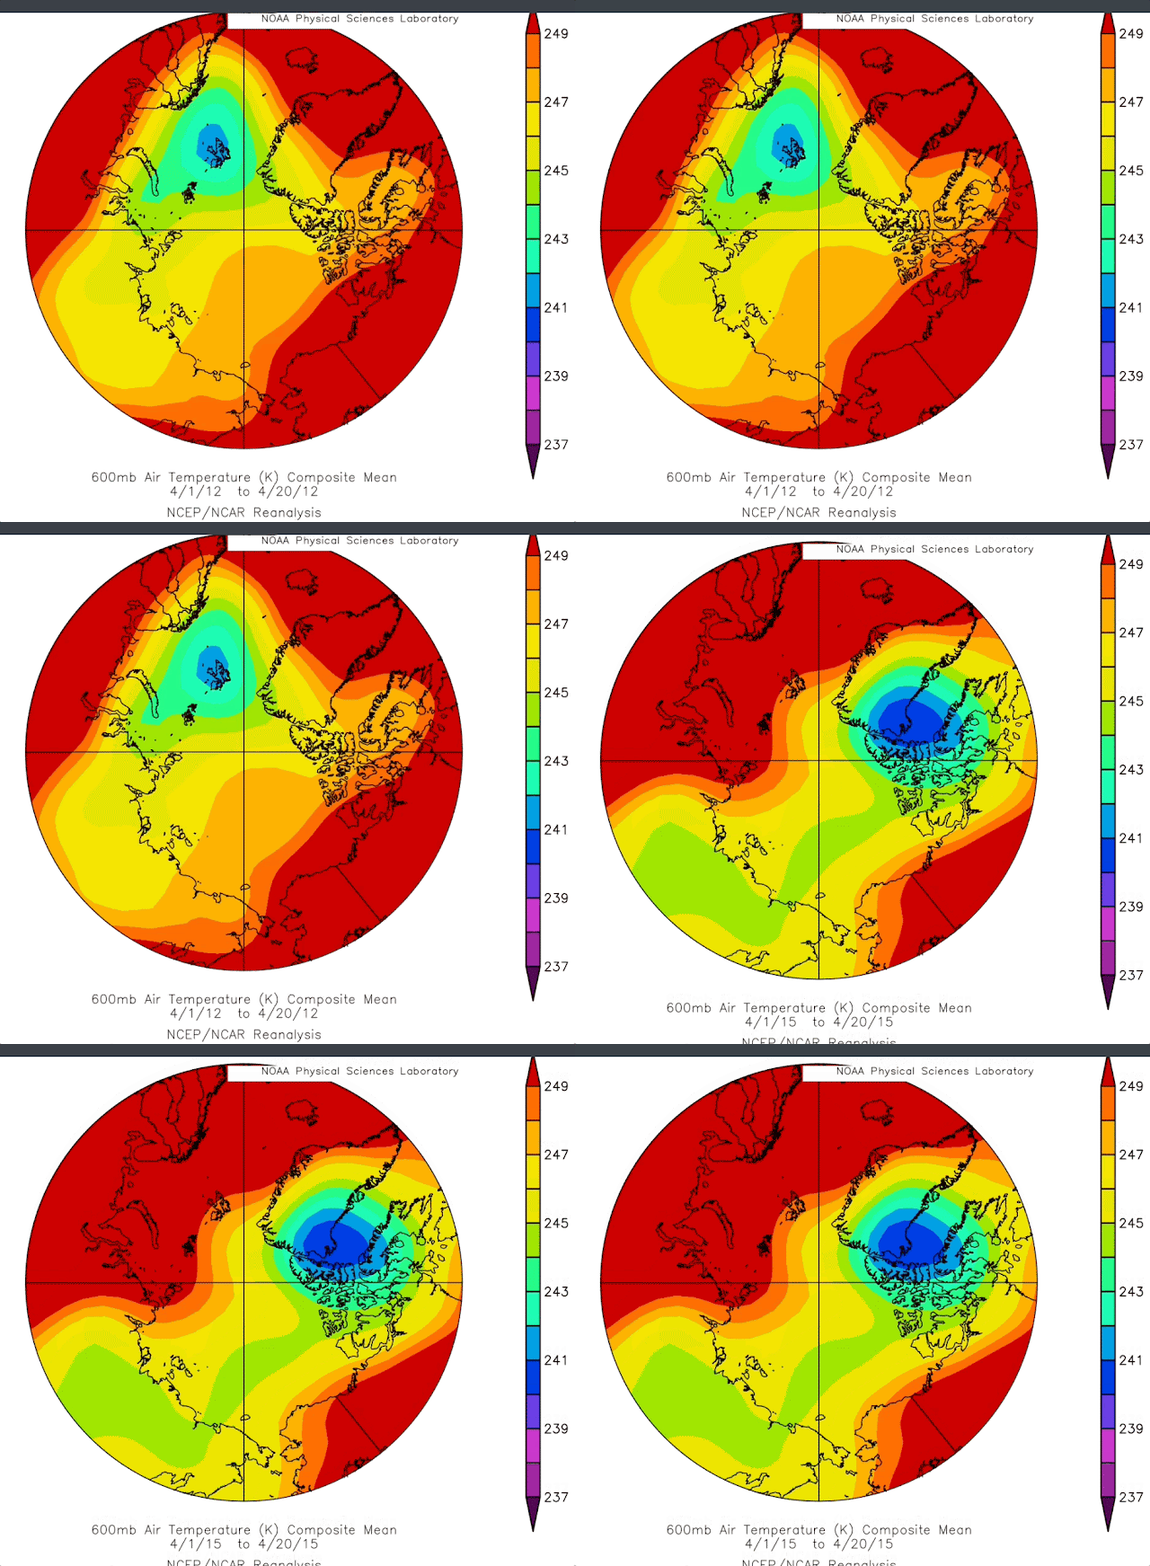
NO is the answer, spot check 4 winter days in the not so distant past, the year when Arctic sea ice was much thicker, 1977, with Arctic sea ice wedged or ridged against the North American side of the North Pole helped create a colder region than Siberia. Remember he Canadian Arctic Archipelago, prior to 1947 had very few people living there for a reason, it was often colder than Siberia. In this spot check, November 11, 25; December 9 and 23 at 600 mb temperature, where the average temperature of the troposphere may be found without calculations. 3 out of 4 of these days, the legendary bitter cold Siberia, was warmer than the Canadian High Arctic.
Fast forward 2015, 3 years after the famous 2012 Arctic Sea ice minima melt, there was the strongest El-Nino in history, Siberia appears dominant cold 2 days out of 4, yet , El-Nino was on the American side of the Pole, so this might be ENSO driven. But recent years observations gradually place Siberia coldest atmosphere of the Northern world during the majority of winter days, a shift, largely due to the Northern Pacific and Atlantic being very warmed;
3 out of 4 same November and December days in 2021, make Siberia the dominant Coldest Atmosphere , a huge pattern shift, Ignore Greenland area, the atmosphere at 600 mb is greatly influenced by ice, there should be dominance of cold air at the top of a Glacier especially when 600 mb winds are calm, so a daily record must consider this. Besides it rained at the top of Greenland this summer past:
https://www.nbcnews.com/science/environment/rained-first-time-summit-greenlands-ice-sheet-rcna1723
Weather wise it has been weird, stranger than usual Global Warming induced changes, the apparent stability of 2021 patterns have been uncanny, gave results positive of nicer milder much warmer weather in Eastern North America, and devastating floods in usually very weather quiet British Columbia. Contrast the 1977 outline of 252 degrees Kelvin and the 2021, same days, weather systems flow around this limit, which greatly explains why B.C. got a greater injection of extremely warmed North Pacific air.


