~Unusual winter CTNP pattern has created a ripe sea ice-scape for a 2007 melt scenario.
~The North Pacific high sea temperature anomaly has been tamed, sort of, mainly on North West American continent coast
~Stable temperatures will start early for most of the US and Canada
~While rains will be confined again to extreme NW Europe
Sea ice First Melt, a sign of 2016 like melting
2 major factors have permeated vast swats of sea ice, one is a lesser snow cover, the other except for a brief period, was a milder High Arctic winter. It is complicated, less snow cover means thicker sea ice accretion, but this was largely tempered by the milder winter in total darkness. This makes the cold sea ice core not susceptible to cause significant horizon refraction, but until warmer spring temperatures happened. Therefore, we have a first year ice likely encouraging a more rapid melt, snow conduction cools the melting process a lot, bereft of strong snow albedo, new year sea ice will vanish quicker.
First sea ice bottom melt can be detected when the astronomical horizon height is equal to the sea ice horizon, it basically tells the melting rate for later in spring and summer.
Last 9 years comparison results includes 2023 next to 2016, a great sea ice melt year. There is great potential for the new sea ice to vanish quickly, given future sunny conditions, which is determined by additional means, so it goes like this:
2018-2015-2022-2023-2016-2020-2019-2013-2017-2021
2021 had a lot of snow on top of sea ice, it is a great factor in saving it from melting fast. 2023 had mainly new sea ice in the observation field, melt pond indicator should be weak given none abundant snow cover not only here but everywhere.
Vertical sun disk diameters, what is the score?
Maximum decimal expanded vertical sun disks per year:
2018 2019 2020 2003 2022 2002 2023 2004 2007 2008 2014 2011
0 0 0 1 1 2 2 4 4 4 4 5
2017 2012 2021 2009 2010 2013 2005 2006 2015 2016
5 6 6 8 8 8 9 10 13 19
2023 was done with 550 sun disk measurements, from 119 elevation decimal levels, with observation period from late February to end of April. 2023 results are in the same modern era of the recent great Cold Temperature North Pole displacement, largely hovering to the Northwards, highly concentrated in the North Baffin to Ellesmere Island area of late. The greatest cooling was determined by refraction measurements especially above 5 degrees altitude, which matches to where Green House gas induced cooling should exist, upwards from the mid layer of the atmosphere, this data is very compelling, as the surface warms, the near horizon sun disks expand along with sunsets shifting Northwards, while the upper mid layer and above cools, compressed sun disks happen, with literally multiple thousands disk measurements confirming this. 2016 was the last year when colder air was less centralized within the Polar Vortex, up to that year the High Arctic atmosphere cold air was more geographically spread out and homogenized. Since after 2016 the Polar Vortex shrank in geography, became highly stable over the said smaller portion of the High Arctic. Sun disk measurements have lost the ability to predict Global temperatures since that year as well. But knowing this gives a better idea of how long the CTNP would subsist into spring. 2018 to 2020 had a very strong frozen area over the Canadian High Arctic. This withered a bit in 2021, only to continue in strength in 2022 and 2023. Its best looking at sun disks between the years 2018-2023, 2023 had the second warmest CTNP at the coldest core of the Polar Vortex, a sign, the stable extreme but smaller cold zone is warming year by year.
Massive Sunset Field shift
EH2r sunset monitoring had the largest field shift in sunset tardiness, whereas the West, the traditional tardiness quadrant, became tame, and the Northwest had very late sunsets for the first time ever. One at 92.54 Zenith angle and some 7 degrees Northwards compared to previous records going back to 2001, there were others up to 3 degrees azimuth Northwards, huge numbers, in the past they were very predictable and tame compared to the Western field. This basically infers a very rapid warming of the ground and sea ice, due to lack of snow and no deeply entrenched in the ground or ice winter cooling during the long night.
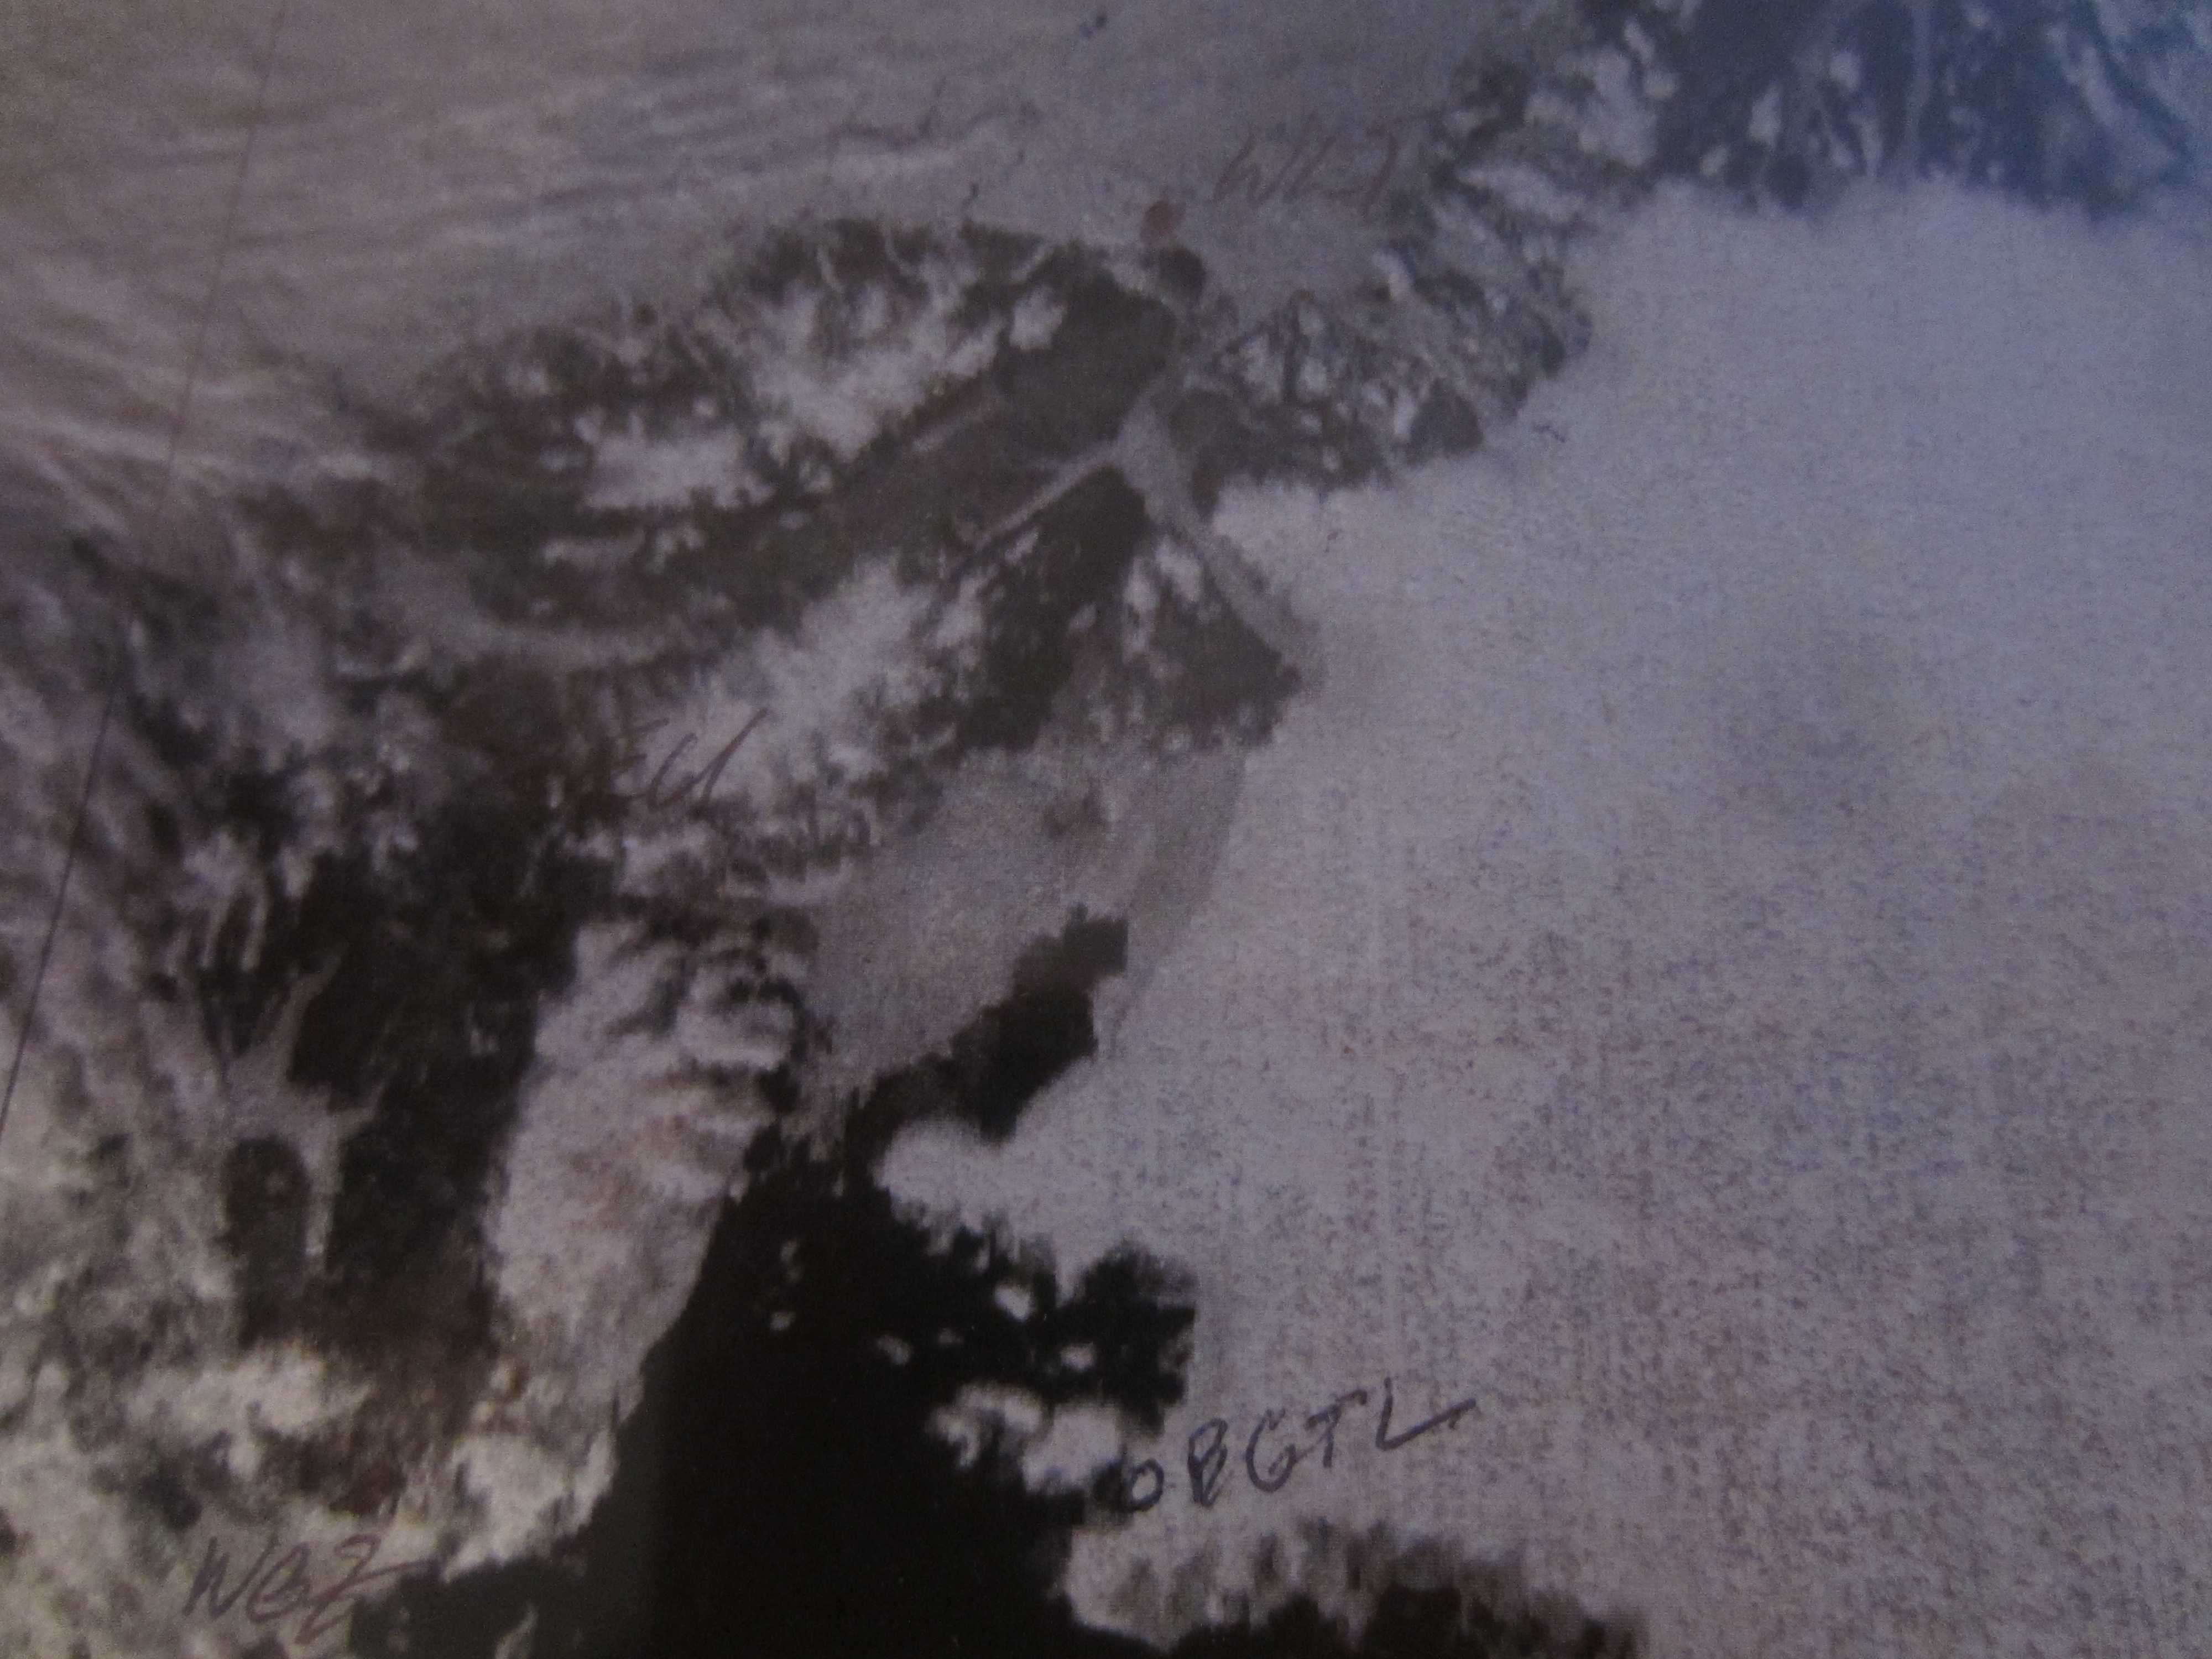
Fata Morgana of Cape Sheridan hill, never seen before in 37 years. 23 of which were intensely observed.
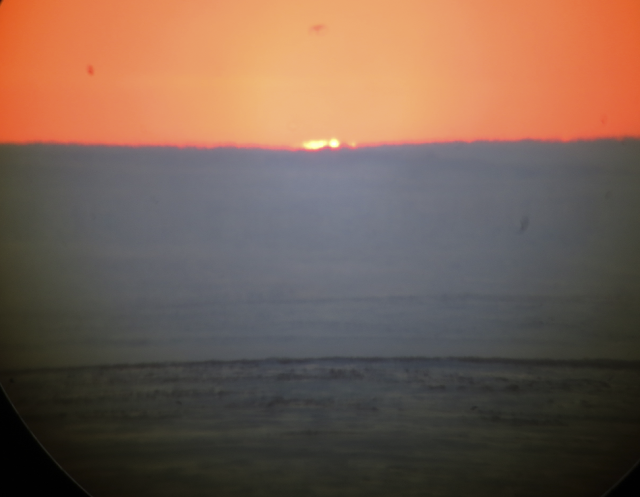
Part of April 7 sunset , 2.54 degrees below the horizon, 7.5 degrees to the Northwards from multiple past steady observations, equivalent of 15 sun disks place one next to the other. Both sun and sea ice horizon line were highly raised by strong inversion, this was never recorded or seen since 2001, the ground surface appears darker, with rock ridges mixed with patchy snow coverage.
This is particularly what Climate Change literally looks like, the optical effects of Global Warming in a place far away from any industry or urban development, as far away as you can imagine, this Arctic land is becoming and looking like a different world........ Map projections in the next article. WD April 28, 2023