Sunday, October 31, 2021

2012 Great sea ice melt retrospective, it was predictable in April

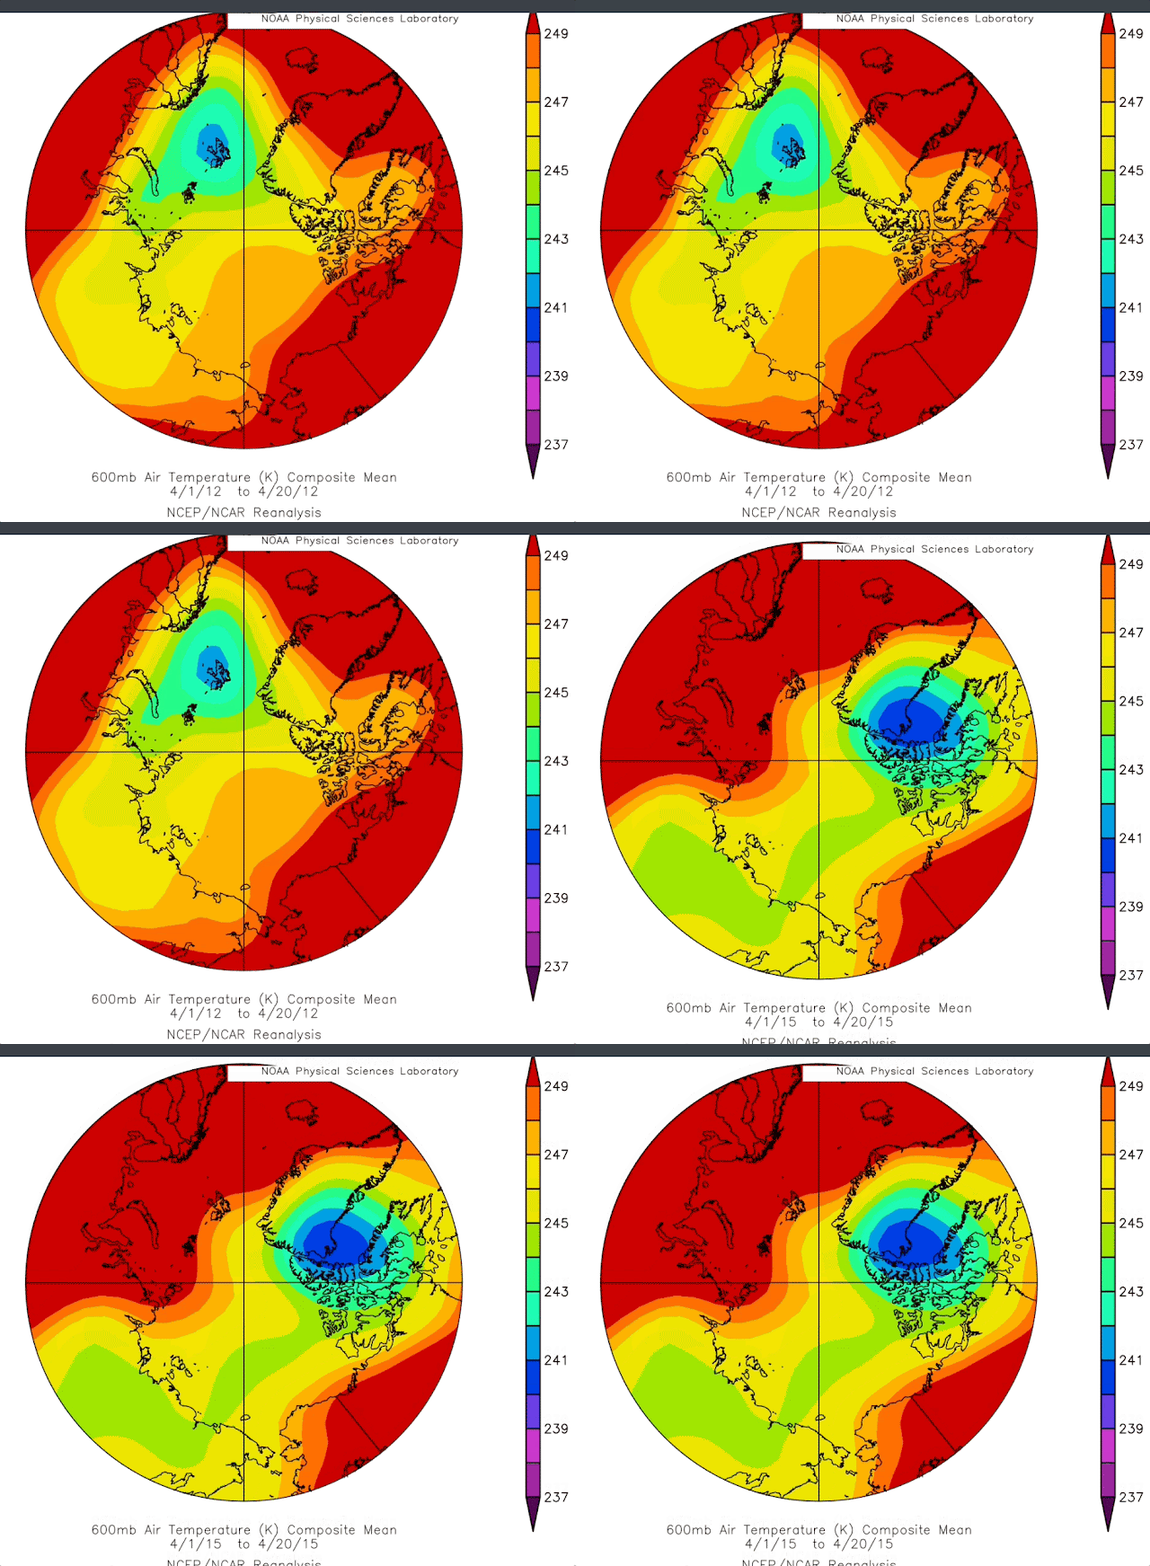
~A refraction magic rabbit (a new way of seeing things,  to be published in peer review paper), popped out of the hat in early spring 2012.  

~It turns out a very warm spring atmosphere made it possible

~Comparison of top 10 sea ice extent melt follows:


Before we do top 10 sea ice melts,  let's look at 2012 vs 1977.  2011 sea ice situation was grim,  1976 was opposite, much more multiyear sea ice was covering the entire Arctic Ocean.  This made it easy for the Polar Vortex to be North Pole centric then.  Notice the green zone -30 C temperature area at 600 mb height (those favoring 500 mb can be greatly confused by stratospheric influences).    2012 was exceptionally warm for the Canadian High Arctic (so did say the rabbit).  

                        Likely #11,  2021
What happened in 2021?     After all 2020 was 2nd place in sea ice extent.  The vortex regained the Pole,
this guarantied a great influx of clouds from the North Pacific sea surface temperature '"hot" blob,  in addition to accelerating importation of moisture by equally super warm North Atlantic, summer Arctic clouds save ice from melting completely hence the appearance of a cold air recovery.

8th Place, 2008 the LaNina Spring super sunshine melt ponds


   2008 vs 2012  LaNina was raging in 08 giving a reduction of clouds ,  causing more insulation, but starting from a much colder spring atmosphere. 

   In 7th position:
Spring 2011 was almost bipolar for the Polar vortex, the Canadian Archipelago very strong vortice of the Polar Vortex assured 2 things,  dry air from North Greenland towards the Pole and the wet North Pacific moisture trust directly towards the North Atlantic,  in imagery words,  apt for good solar input for the Arctic Ocean,  
#6  2015 the warmest year in history then
The waning -30 C green zone plus the Baffin Bay centric center of the Polar Vortex,  similar to 2011,  assured 2015 prominence in melting.
#5   The sun melt year: 2007
2007 600 mb  spring temperature was practically similar to 2012 the area having the greatest melting by sunshine was North of Alaska Beaufort sea  we can see clearly a favorable North Siberian in provenance circulation of dry air. 
  #4  super ENSO warming; 2016 
2016  green -30 zone shrank to near 2012 dimensions along with a stifling encroachment of red (-24 C) areas all throughout the Arctic ,  again favoring dry air from Siberia sun warming.


3rd sea ice melt place; The great small but very cold CAA Vortex 

2019 may seem much colder than 2012,  however North Atlantic and Pacific had a very warm spring atmosphere.  Again key,  dragging dry Siberian air over Alaska and Eastwards,   The Canadian Arctic Archipelago vortice was measured stubbornly in place for the longest time assuring these dry (less cloudy ) air conditions. 

2nd only to 2012:  2020
The second most powerful sea ice extent melt had no blue zone (-33 C) similar to 2016,  we can also note the heat strangling cold areas red zone, particularly South Greenland Baffin Bay,  but in particular the position of the polar vortex center,  North Pole centric,  not because there was thicker sea ice there , but because it was coldest there.    A stable warm area encourages a stable cold center which was the Pole. Also noteworthy; North Alaska air being warm after the long dark season seems to assure a forthcoming great melt

    All in all we can now project with a greater deal of precision whether the sea ice minima will be small by mid-April,  another prediction tool thanks to said "rabbit" refraction trick which suggested looking at these holistic temperatures.  WD October 30 2021

Tuesday, October 26, 2021

Cloudy days heat transfers, 3d sea ice transforms, a different perspective about 2021 summer sea ice melt

   October 6 2021 arrival of Arctic Ocean multi-year pack   completely flattened,  thin,   not changing sea water temperature a great deal,  not stimulating new ice to form.  Of which sea water temperatures were abnormally warm,  despite said presence of pack ice. Open water above 0 C temperatures of end of September rivaled 2012 same date measurements.  

~It is important to consider sea ice extent in all its dimensions.  Not just compare the horizontal one.

~Whereas a penetrating 2007 or 2012 sunlight melt didn't occur,  there was a great loss of ice nevertheless

~The proof is in the size of multi year pack ice,  usually seen floating away from the Arctic Basin looking like a mix of first year and much older ice with various height profiles,  giving the impression of a spectacular jungle of sea ice vertical shapes, 2021 had no such great old tall forms to observe.  

  Surface temperatures October 2021 are the warmest the Canadian archipelago had in history,  despite 11th place finish of Arctic sea ice extent at minima.  The disconnect between the two suggests a much warmer sea,  spreading around heat more evenly,  even under a huge area of intense cloud cover lasting months, with very little insolation to speak of. 


2021 October 26 (left) and 25 frost and drizzle accretion,  South Cornwallis Island (-1 C weather).    With end of October 16 C above normal,  almost everyday was at record or is a record maximum temperature for the entire month!


      October 6 sea ice arrival,  speaks for self,  especially for those who are use to seeing fall ice movements. WD October 26, 2021


Friday, October 22, 2021

2021 sea ice minima story, it was bad, despite what the numbers suggest.

 ~Hi,  nice to be back after a little break

~ I did not expect 2021 Arctic sea ice minima to be greatly shattering 2012 record because of North Pacific in origin clouds.

~Summer 2021 clouds were even more extensive than expected since even the Atlantic sea surface temperatures were extremely warm as well.

~ With these overheating North seas,  there was no way for an expansive prolonged  sea ice exposure to summer sunshine. 

~Yet this was a terrible year for sea ice nevertheless,  despite 11th place historical finish,  the remainder ice seen streaming through Arctic Archipelago Straits were never observed so thinned, demolished, emaciated and flattened.  

2021 sea ice minima was a good 1.4 million square kilometers shy of 2012,  failing 2020 2nd place as well.   But there is a difference between these years,  and it was cloud pervasiveness,  which persisted and continues till this day going back to June.  There is also quite compelling piece of evidence of sea ice extent being near all time lowest at present, in summary:  no recovery at all is at play,  rather a form of heat embedding through different means.  Clouds during Arctic summer make it cooler,  but come fall if continued,  flip autumn temperatures much warmer:

NOAA 30 day surface temperature anomaly says it all,  the Canadian Archipelago average temperatures are hovering between 10 to 20 C above normal.  This does not stem from much more minima sea ice,  but from a warmer Arctic Ocean which has not melted completely because of extensive cloud cover, end of summer clouds saved the ice but did not foster rather stymied a cooling rebound.  

   Extra wide areas of extreme warm sst's for both North Atlantic and Pacific are the prime source of world wide heat injections particularly by water vapor,  a potent greenhouse gas,  which adds to the others us humans tend to dump in the air.  

   Next reports will cover the emaciated looks of surviving multi year ice,  why Siberia is now the last refuge of winter buildup and a retrospective of 2012 minima, which was baked in the spring well before summer solstice sun.  wd October 21 2021