Friday, June 13, 2025

Arctic Basin pressure system switchover, on schedule

~A helpful defence against complete meltdown of all Arctic sea ice


   Arctic Ocean pressure system summer switchover occurs when Arctic cyclones persist over colder areas, as opposed to winter hugging over warmer sources, such as open sea water.  It is a phenomenal counter melting action, which saves sea ice extinction.   It turns out to be also,  a bearer of more Arctic rains on the Canadian  Arctic archipelago, furthering the detriment of permafrost,  which when warmed furthers the presence of Anticyclones which persist over warm sources in Arctic summers.    The reverse 
scenario, may happen,  such as during summer 2007, when a High Pressure system persisted over the Arctic Ocean gyre area, exacerbating the sea ice melting a great deal, even of very thick sea ice, this was likely a dynamic pressure blocking scenario, or just as much from an extreme heat wave over Arctic lands spilling over to sea,  which invites the presence of a steady High pressure system 

   CMC surface analysis, June 13 2025 00 UTC.  A Gyre Low, counters the normal Gyre clockwise current, which was powered by many winter months of a steady High pressure system.  It is characterized by colder temperatures,  likely sustained by clouds, which are a plenty when warm moist air streams over colder sea ice. The clouds and sea ice maintain a colder surface than adjoining areas bombarded with sun rays to the surface. I see the Great North Pacific warm temperature blob as the main source of moisture sustaining this balance of clouds.   Of Course, the North Atlantic , equally warmer, is another source. 

Referring to beginning of May projection from this website:


https://eh2r.blogspot.com/2025/05/2025-late-spring-summer-and-early-fall.html


   The rain onslaught is starting, only an extreme heat wave can break this from happening. WD June 13, 2025.


Tuesday, May 20, 2025

ENSO shift? Not seeing accostumed sea surface temperature platform chart, puts single station forecasting/projections to the test

 ~Not reading fresh NOAA sst maps makes ENSO forecasting harder


       Ground hog April 7 day, not renewed NOAA SST chart,  with a stuck in the past one day display, at least suggested then, a return to El-Nino.  There has been no daily production since.  Kind of removing an important forecasting tool.  

  Luckily, U of Maine reanalyzer posits otherwise.:

A reversal?  At least it reads so here, but everything is blurred again, the North Pacific strong sea temperature mega blob nesses ENDO predictions a great deal, especially from an Arctic point of viewing.  


May 19 2025 Massive Arctic cloudiness, multi layered, long lasting,  would, according to  ENSO cloud seeding theory,  suggest a return of El-Nino.  But it appears that the great North Pacific sea surface heat  blob,  much more so than  Atlantic influence let alone ENSO gyrations, will once again save the Arctic Ocean sea ice from total obliteration. 

The MIMIC look is astounding, wave after wave of Northward moisture, likely to continue all summer,  ensures little chance for a 2207 like July mega melt.  Indeed to  be enforcing, as projected, a quasi permanent Low pressure sitting a top the Arctic Ocean basin Gyre area.

    Likely spared summer sea ice does not mean recovery,  the Arctic sea ice Maximum is shrinking every spring, the ice is equally thinning every melt season as well.      WD May 20, 2025


Sunday, May 4, 2025

2025 late spring summer and early fall weather projection, a lot influenced by refraction data

 ~Still after 21 years,  unorthodox

~There was a shift with previous 2 years, potential reason: it snowed more over the Arctic Ocean

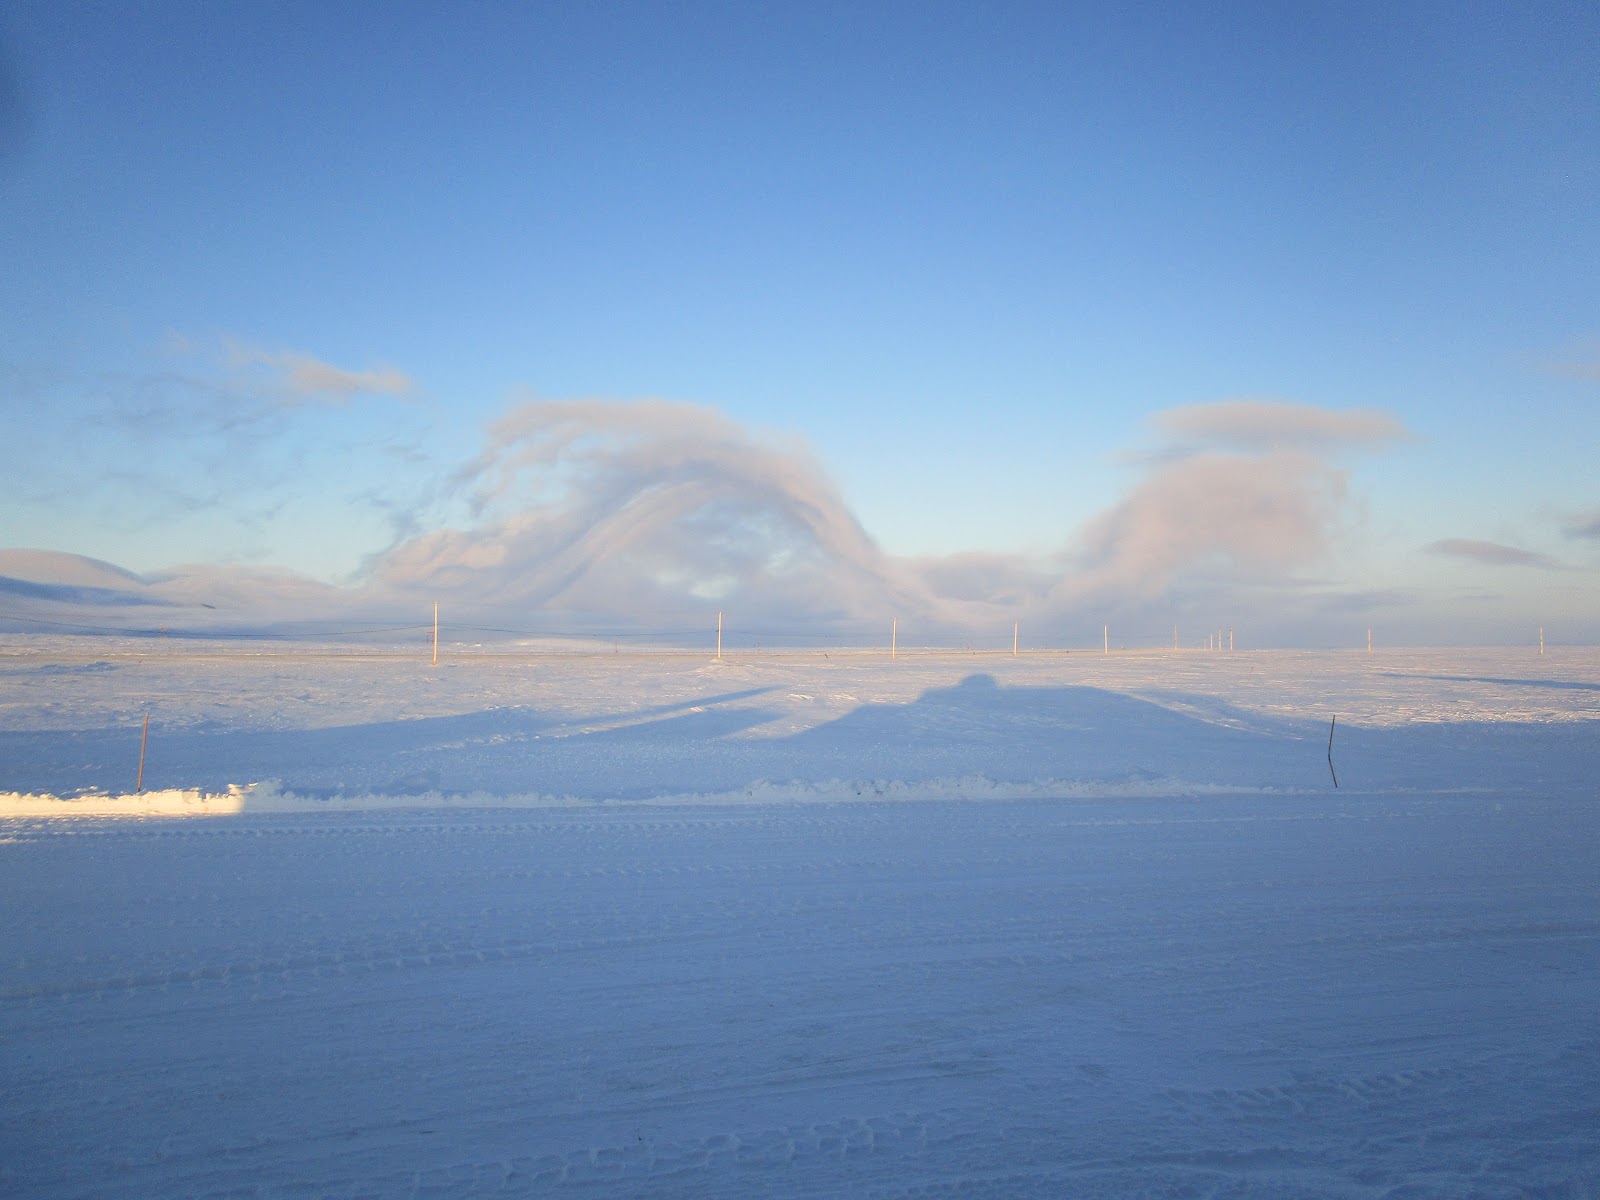
  I am a bit late this year because of equipment malfunctions, with only 150 sun disk measurements,  I could only partially surmised the evidence with previous years, what it showed was the return of the spring CTNP, Cold Temperature North Pole,  over the Canadian Arctic Archipelago.    Which would have meant a break with last year more expanded sun disks, however it is complicated,  late winter very early spring sunsets were much more roundish, onto itself describing very important warming.  As said over the years, a sun disk measurement is an extremely accurate description of the temperature of the entire atmosphere. Arctic surface  touching lower sun limbs come often distorted,  it becomes not only a temperature of the entire atmosphere, but rather a very accurate description of the extreme lower atmosphere. It often looks like a spectrum with lines of the interface between air and:  ice, land or sea water.  Visualizing rounder sunsets is an important observation, it implies a significant warming over a very broad swat of the atmosphere.   March and April 2025 was much warmer than usual, with often days 10 C above normal.   This variation unto self, has caused some sunsets to be later, but most were lame in tardiness.  

   Sea ice was again thin,  some 50 to 80 cm thinner than the not so distant past.  It could have been even thinner, was it not for lack of snow cover and the strong wind storms being more common.  Thin sea ice combined with spring sun rays effectively start the sea ice melting season,  which was the earliest on record, as judged optically by the phenomenon called "first melt".  That is when the Astronomical Horizon is regained. When so ice at the bottom of sea ice looses accretion because the sun warmed up the top part enough this happens in the afternoon, for longer and longer time as the sun ascends further.   First melt has two basic components, the first sighting and subsequent  distinct period of when it occurs regularly every day,  the former was March 25,  the latter was very early April onwards. This is an indication that sea ice will melt earlier than expected likely throughout the Arctic. 


   May 2025 projection.  A strong presence of the Cold Temperature North Pole,  even in a  warmed world,  there will always be one.  C marks the spot the smaller c is the secondary just North of Eurasia. A high pressure should dominate the Arctic Ocean basin area,  until early June, the fading jet stream in yellow will collapse at a likewise time. A slowly moving Northwards High pressure will dominate the Canadian American boarder area at about Saskatchewan.  North Pacific and Atlantic Highs will substantially add heat to the already warmed oceans.  Gulf of Mexico moisture carried by cyclones will also be a common feature all the way to Newfoundland.   

     A smaller CTNP should lodge just off the North Pole on the Russian side.  The ever so present Arctic Ocean High pressure Gyre will switch to a near permanent cyclone  mid June, because of apparently extra  thicker snow cover,  which should transform in ice ravaging melt ponds, but the cylone clouds will be easing the sea ice melt from being extreme. Extra cloud feature alone slows the coming of a catastrophic total sea ice melt event.  Warmer Ocean in origin  clouds reflect sunlight otherwise destined to melt everything.  But the much warmer Oceans will one year overtake the benefits they give.  Main summer Archipelago feature will be the rains mainly fuelled by the much warmed North  Atlantic and Pacific.  The Polar jet stream will vanish early June  leaving Northern Hemisphere circulations to languish slowly or stop for days.   Again High pressures will dominate Central North America bringing even more warming to the Arctic.  Absent Polar jet stream with much warmed sub-Arctic will extend the number of days with heat waves everywhere.
   The white line over Arctic ocean is sea ice extent at minima. I expect a massive melt despite extensive Arctic clouds.  Year by year sea ice is thinning, despite expansive cloud albedo reflections, that is because Maximum is not sparred from warmer winter during the long night, sea ice in March was measured to be all time lowest in history.    Hurricanes should languish going nowhere or hug the coast of Gulf of Mexico and East Atlantic, not driven fast but stirred by synoptic weather .  Early autumn break from the rain awaits much of the Arctic.

    Not having a full slate of sun disk observations makes an ENSO prediction difficult,  usually sun disk diameter expansions have been linked with a surging El-Nino conversely more numerous than usual sun disk measurements were directly linked with La-Nina.   However, I can interpolate,  there was a lot of clear days until about beginning of April, suggesting either end of La-Nina or surging one.  whether of the 2 was answered in Cloudy April, La-Nina unlikely.   I have only one tool left from the sky which helps determine El-Nino,  and there was numerous extreme high clouds, beyond 25K laser range. Presence of  these gave a strong affiliation with El-Nino, so there is a likely coming El-Nino, if so good for sea ice given the extra clouds will spare extra melting. Despite all this, Arctic sea ice extent at Minima should be slightly lesser than 2012. WD May 4 2025

Sunday, April 27, 2025

Roller Coaster clouds, mechanism confirmed by rapidly varying in direction winds and sudden refraction readings change

 ~Low clouds shaped by North to Northeast taking turns with Northwest winds,  natural art with interesting science.

~They implicate co-existing micro to macro dynamic structures, a rather much more complex meteorology, stubbornly mostly invisible. 

     The wavy nature of these just prior straight clouds, well away of a hill, are Roller Coaster clouds,  straight away from the camera lens is the Northwest, 90 degrees right Northeast winds cause the clouds to descend . You can note on the second wave, the up and down curve  mimics a coaster.  It turns out that the sky refraction varied when one wind direction dominated versus the other.  

20:00-15.8-18.381LegendMM3517 101.38 -24LegendNANA
21:00-16.8-20.176LegendMM134 101.31 -29LegendNANA
22:00-18.3-21.278LegendMM3221 101.31 -29LegendNANA
23:00-18.8-21.778LegendMM3527 101.24 -30LegendNANA

Southwest Cornwallis Island consist of a raised beach descending to Barrow and McDougall Sound,  it has a  200 to 300 meter raised plateau a few Kilometres Eastwards from shore.  Hourly winds of record on April 25 also miss the Northeast gusts which happened late in the Evening (6th column is wind direction, 7th is speed in Km/hr.). 


The camera is aimed towards the Southeast, again occasional winds from the North or Northeast, in irregular sequence with winds from the Northwest created these spectacular Roller Coaster clouds, 200 meters or so high, touching the ground at about 40 meters.  

      At the same time of these I measured sun disks varying in dimensions confirming the mixed nature of the air, one was colder the other over all warmer.  This well defined cloud geometry is again the first time witnessed or filmed by me, this was a very rare event.  Surely something like this occurred in the past with only lenticular clouds far from touching the surface.  The refraction bit is quite exciting, it is not unusual to measure wild variations in sun disk dimensions, these are still a great puzzle,  because invisible air does not define. However, variable refraction moments indicate unknown un mapped air pockets,  some quite large and lasting, some fleeting and small.    This definitely indicates a rather complex atmosphere abounds all around us, sort of a field of Lorenz mega butterflies, may trigger, detour, reshape, stall or accelerate ongoing patterns.  This complexity may be known by some carefully looking at surface weather maps, showings mysterious small Lows or anticyclones, rather captured by satellite pictures and positioned on a weather chart.  There can be an abundance of small vortices, or on some days, none.  These are what makes weather difficult to predict,  they also can be uncovered, but no one is actually seeing or mapping them enough, EH2r introduces the beginning  tip of a discovery iceberg  perhaps leading to a radical different weather map never imagined, surely to be achieved, on a  future perfect good forecast spanning much longer than a few days. WD April 27 2025  


Sunday, April 6, 2025

Leads everywhere! State of Arctic sea ice after Maximum extent 2025

~Again  never seen before, new Spring time Arctic Ocean  icescape

    April 20 1988 NOAA infrared satellite , Arctic Ocean surface ice looks bland, very cold,  nothing very much to report about, leads were found with difficulty, yet the setting for this picture had an extra effort application to find them.  Look at Smith Sound, the reverse V polynya in black, North of Baffin Bay, between Greenland and Canada.  There is some warm sea ice just to its South in faint grey. If there was any open water leads about the North Pole, they would have appeared in black. By the way, Smith Sound polynya feature is a complex creation of ocean currents, but in particular Kennedy Strait (North of the inverse pointed V) being solidly frozen, this allows many non migrating species to survive the winter, with more spacious open sea water.

Same picture, this time set to really look for the leads about the North Pole, there are many covering the Arctic Ocean, but these are old, likely some are multiyear old,  frozen over and thick.  The photo was enhanced to highlight dark colours, so much so that the IR temperature setting basically shaded land areas black, these were warmer further South, except for of course Greenland. 


Flash forward April 3 2025, NOAA IR HRPT Photo:


     Leads everywhere  you look about the Arctic Ocean having warmer sea ice surface,  Smith Sound Polynya deformed, viewed from space the planet appears to have  obviously warmed,  remember this photo is taken 2 weeks earlier than the 1988 one.

  The photo clearly demonstrates a sorry state of sea, deteriorated in a mere 37 years.  WD April 6, 2025


Thursday, March 13, 2025

Very bright twilight or possible sunrise beginning of long day at the North Pole, 8 days before March 21

 ~Atmospheric refraction bends Earth's Terminator

~ Likely enough to cause a sunrise after long night. 


   March 13 2025 NOAA Satellite HRPT Visual Loop, shows the Terminator line, that is the border between night and day as the Earth rotates, here is a North Pole view. The terminator line is not straight, reflecting the varying atmospheric refraction properties which also depends on sea ice thickness. 2025 sea is likely at all time thinnest levels,  a very thick icescape would easily bring out a North Pole  sun on March 13,  however a very cold surface air just below much warmer air would do the same even with thinner sea ice. So it is a matter of being there at the North Pole to confirm this.   In this example, there was a stagnant pool of cold air spanning from Greenland to the Pole. This was enough to bend the terminator at the Pole,  therefore  a strong possibility that the sun line is present. 


     Same loop NOAA HRPT infrared.  Just North of Ellesmere Island is almost to North Pole "white zone", seasonal cold air,  being mixed with approaching cyclones from the North and the South.  This cold gives an imprint on the ice,  certainly capable of changing the horizon significantly especially after a sudden warming. 

 On a certain March 13 in the late 1980's a very capable de Havilland  pilot named Russell, flew near the Pole to confirm that it was bright enough to land a plane there.  There was enough contrast resolution to land an aircraft on natural sea ice while refraction surfing the light rays beyond earths shadow.WD March 13 2025

Monday, February 17, 2025

Big Lead no more straight, follows the coasline instead.

 ~A continuation of never seen before events


Radarsat NW Canadian Archipelago February 17,  The big lead just shows up, wuite remarkably clearly. 


NOAA HRPT loop same day, this time it is a wind driven opening, at winter's potentially coldest time.  In the not so distant past, this was a May event. On coldest  winter the big lead  also appeared more straight alongside the Canadian Arctic Archipelago NW shoreline.  WD February 17, 2025

Friday, January 31, 2025

Potomac crash flight paths, and background refraction


 -Actively looking for refraction effects, especially from street  lights, inconclusive from yet good video evidence.  The flight paths of both aircraft was captured pretty well, because of fixed mount of camera. The jet was descending slowly, while the helicopter appears to have changed altitude directions twice.

taken from:

https://www.youtube.com/watch?v=ZUI-ZJwXnZ4

the fix frame camera is very helpful, especially in detecting mirages, which did cause aircraft accidents on occasions in the past.  RIP to those lost, and condolence to families...WD January 31 2025. 

Tuesday, January 28, 2025

Never seen before series; this time great Arctic Ocean low cloud wave

 ~As far as I can remember  (with satellite photos observed since 1985), never seen such a wave of low altitude warm clouds of this magnitude in January :


NOAA Infrared HRPT loop, January 27 to 28 2025.   Massive low cloud wave, in black, since it is warm, coming from the North Atlantic, covering about 1/4 of the Arctic Ocean in about 1 day.and a half. Usually these were seen in narrower streaks. between Anticyclones and Low pressure systems. I do not recall seeing such a wave being so expansive. Note Greenland dryer air area of influence. There is a High pressure system on theNorth Pole to Siberia quadrant. WD January 28, 2025


Friday, January 24, 2025

More Never seen before sea ice events; the "big lead triples", and wide openings North of Greenland in January

 ~These are absolutely clear signs of a different Arctic winter sea  icescape. 

NOAA HRPT infrared picture, January 24 2025.  There are 2 "big leads" quite distant from Canadian Archipelago shore,.  These are mostly tide constructs along with winds. The "big lead" use to be a controversial subject originally described by the early North Pole explorers, the likes of Peary and Doctor Cook some 120 years ago.   The advent of Polar orbiting satellites proved them right. But the traditional "big lead" usually formed NW along side right near the archipelago.   Now there are 2 more of them...


    Note, the map overlay is offset, in green is the original location of the "Big Lead",  there are still signs of it here and there.  The historical "big lead" can be many nautical miles wide, appearing especially at or near full or new moon days.  In red, are the new ice order leads, distant and far away from the coast, likely due to the thinner state of sea ice.  

 Next Extraordinary appearance of wide open water, North of Greenland:


A remarkable, extraordinary NOAA Infrared HRPT ,  January 16 opening seen where usually only thin leads occurred, there is a water sky, on the East side of the opening from an open water source.   North of Greenland  ocean is where sea ice is pushed outwards to the East and South aided by tides.  All kinds of activity happens there,  numerous North South thin leads were the main features, indicating pack lice breaking up.  But these where only on Greenland extreme NE shoreline, the break zone now extends much further westwards   On Radarsat it looks even more chaotic: 


North of Greenland January 15 and 24, 24 has many more dark openings especially on the coast line...   Very strange, never seen midwinter event.  Again signalling a more fragile and overall thinner sea ice, breaking up wider more easily because it is less dense.   WD January 24 2025


Thursday, January 16, 2025

Canadian Arctic Archipelago Arctic Ocean significant Tidal Zone moved South

 ~The active Arctic Ocean  open water tidal zone moved 170 Km Southwards in 2025


Just North of Amund Ringnes, circled in red, is an active Tide Zone , as of January 14 2025, way South of where it use to be. 


RADARSAT Canada expanded viewNovember 28 2024 and January 14 2025, really brings out a wide active zone, which opens and refreezes again and again just North of Amund R. .  The Arctic Ocean zone of activity was further to the North between the Northernmost tips of Elef Ringnes  (extreme top left) and  Axel Heiberg (extreme top  right) Islands, just North of Meighen Island, the little one in the middle in between the two.
Remains to be seen whether this new Active zone will last all winter. WD January 16, 2025

Tuesday, January 7, 2025

EAST Hudson Bay wide area boating season January 5 2025

 ~A current live event for Anthropogenic enhanced Global Warming.

~ Following up from this EH2r article: "https://eh2r.blogspot.com/2024/12/hudson-bay-revisit-wide-open-water.html

JAXA University of Bremen Sea ice extent , Hudson Bay complete freeze-up will be very late this season, a wide open boating season continues far off the entire  East Coast.. As of January 5.  


 "Freeze-up begins along the northern shore in September and gradually ex- tends southwards and eastwards. In the southeast, freeze-up occurs last, typically around the first of January. "  Eric Danielson Jr U. Of Calgary:

                Danielson's 1958-1965 data analysis.  Freeze up date boundaries,  truly tentative data though

From Sven Sungaard an important Graph:

     November 12 Hudson Bay sea ice extent 1971-2023.  1998 was a true starting point for Arctic wide perception of extreme warming.  Now lets look at Nov 12 2024:

"0" 

                                                                 Nothing! Apparently no sea ice.

   It is 19 days later than November 12  when a thin sliver of sea ice appears this season.....


Recent world wide warmest years in history had 100% coverage mainly around Christmas.  Current Hudson Bay complete freeze up awaits a date.  WD January 7 2025


Monday, January 6, 2025

Never seen before redux, this time just North of Amund Ringnes Island

~A tidal lead never seen before in January:


                                                  Surrounded by red dots Amund Ringnes Island

    Very rarely mentioned, nor frequented, Amun Ringnes Island fame occurred long ago when it was first discovered in 1900 by Otto Sverdrup a Norwegian explorer. 

Just to its North a Tidal lead which opened about a week ago:

   Onto itself, Arctic sea ice Archipelago channel wide tidal leads are more frequent in the spring to fall, not in January, very few occur nearly year round, they are mainly caused by strong tidal currents.  Detected by NOAA Polar Orbiting Jan 1 2025 high res satellite.  This Amund Ringnes never seen in January event, is merely an extension of the Arctic Ocean lack of thick or ridged sea ice in the not so long ago past assuring a winter permanent presence of ice at the same location, there was no such wide openings possible. 

 A closer look Radarsat look at the lead , January 5 just frozen, but appears to break open often as frozen tide lead lines indicate.

WD January 6,7  2025