Wednesday, March 15, 2023

An accurate historical timeline, vital for climate studies. New Archeoastronomy discoveries. Akhenaten Boundary Stelae linked with the Great Pyramid architecture might help perfect our Ancient Chronology,


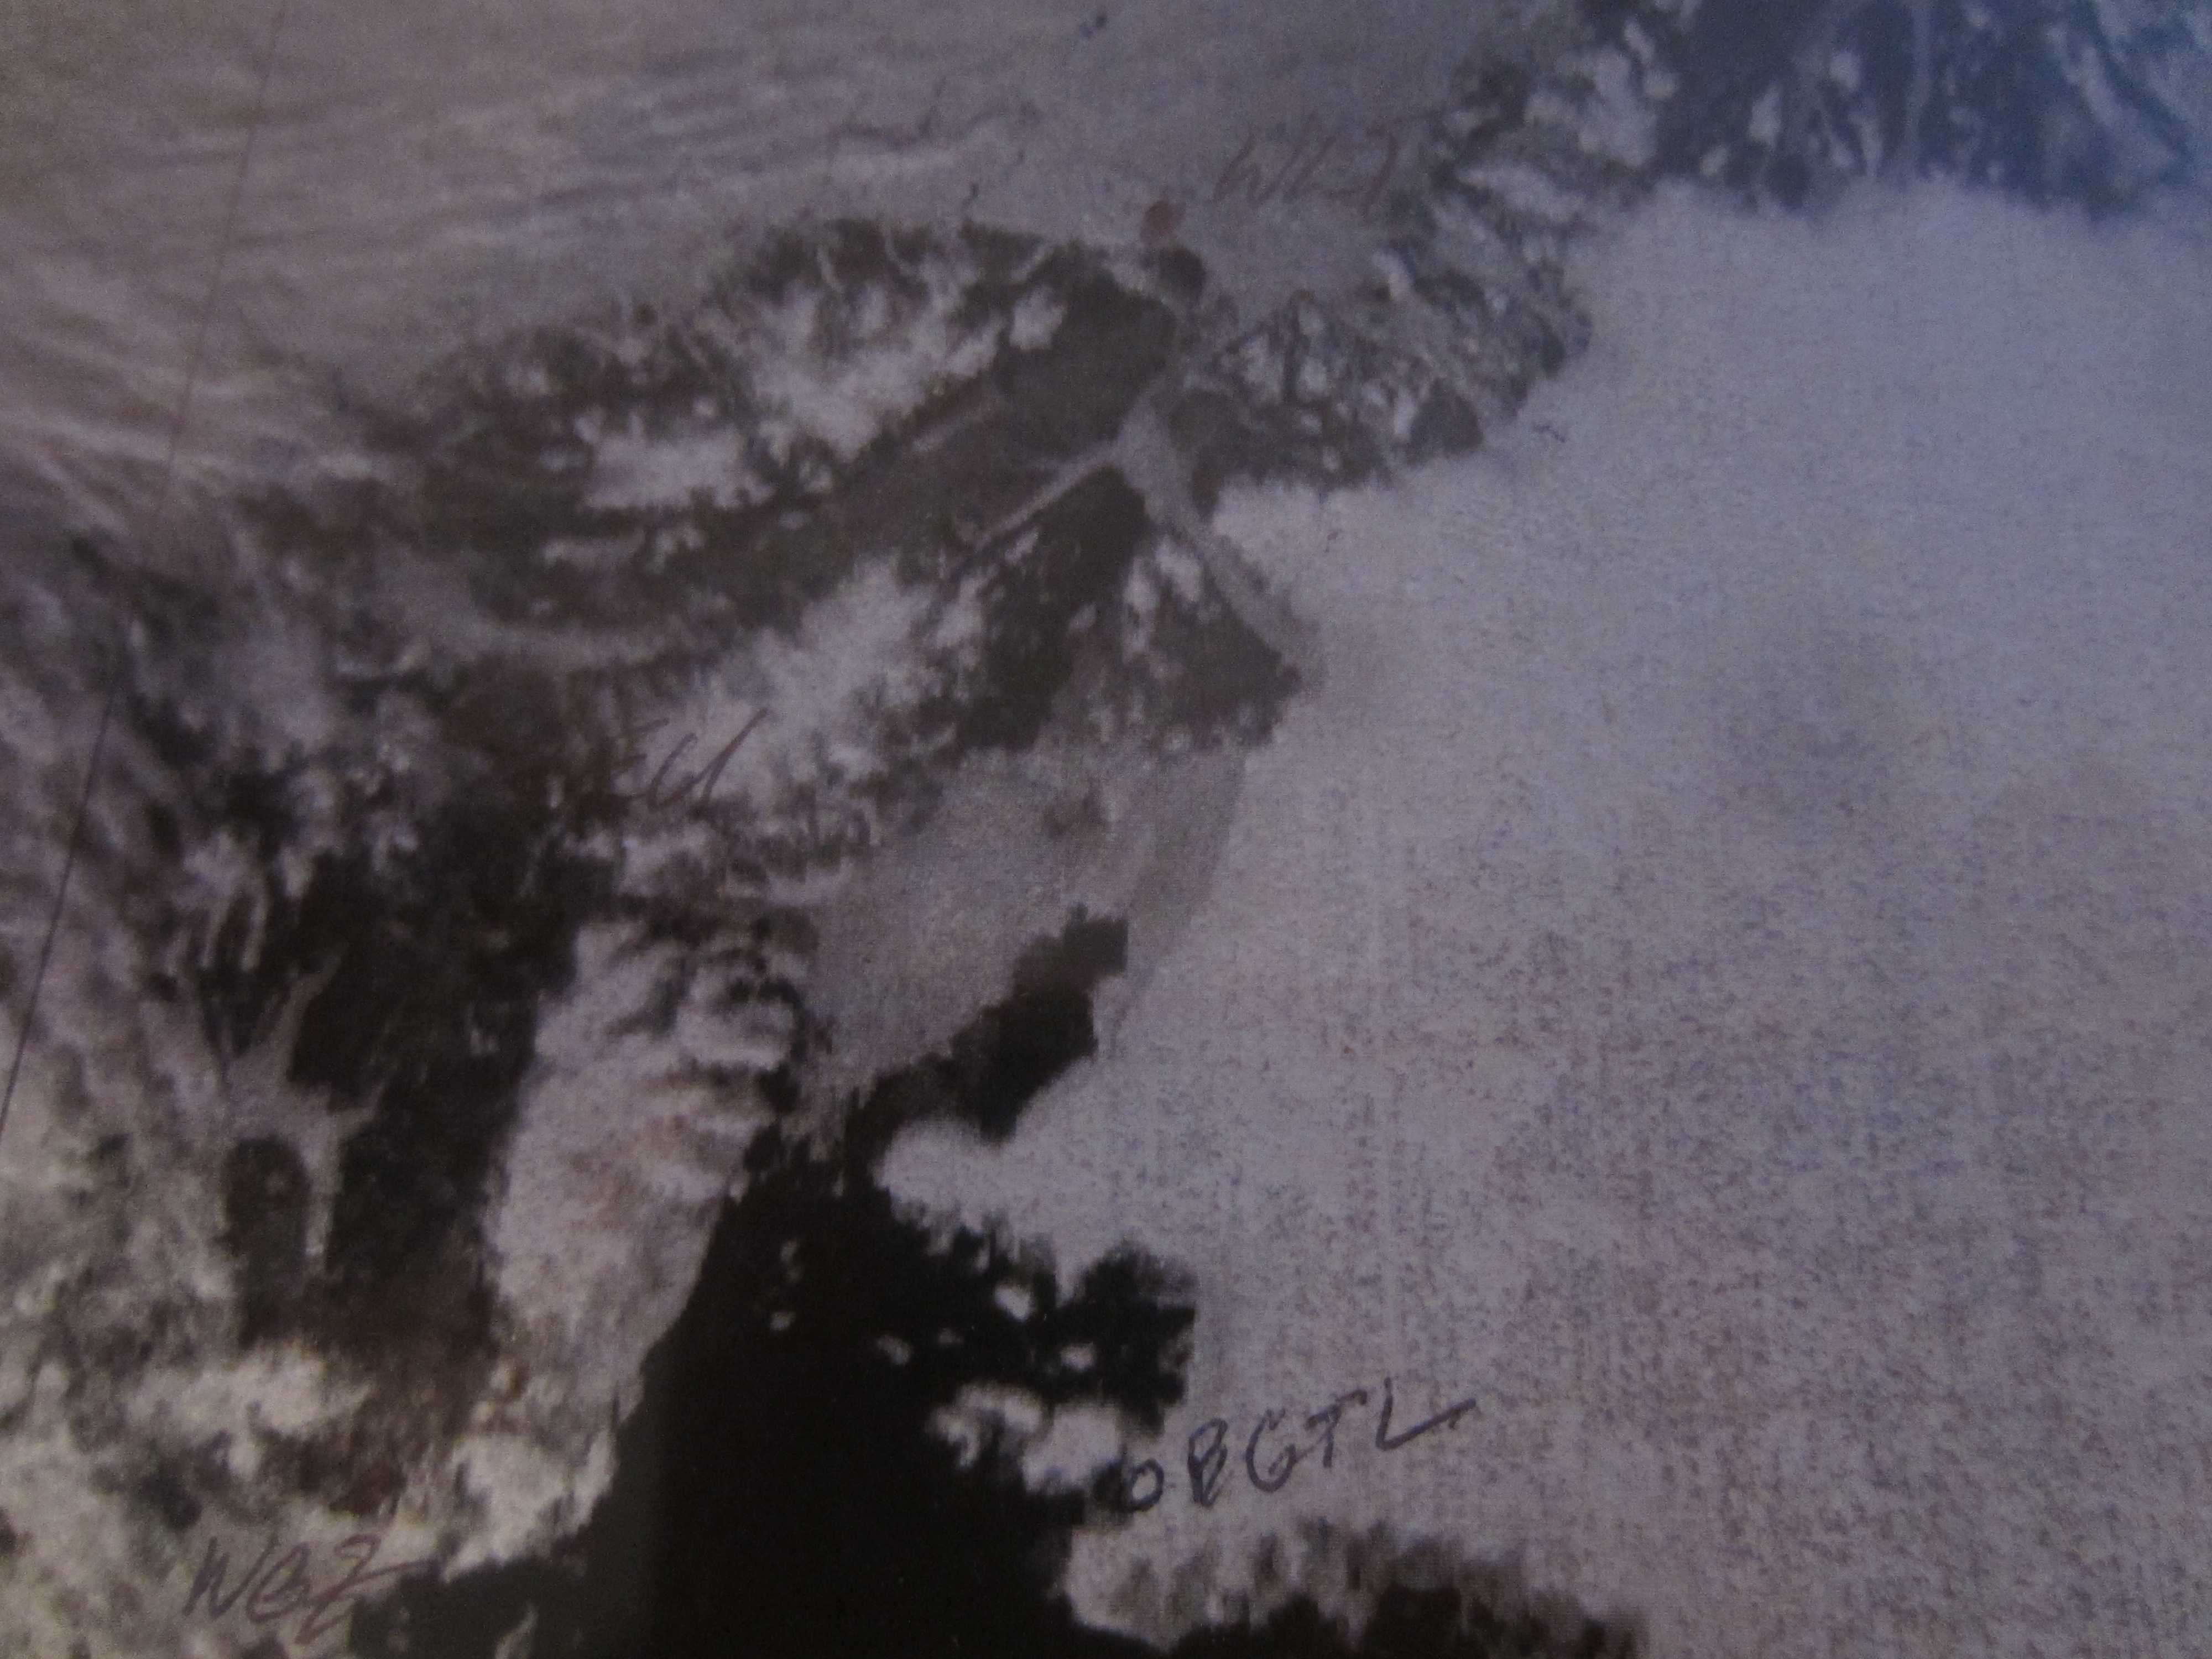
 On this well leveled photo,   we see boundary stela B,  at tell el-Amarna, ancient Akhetaten , juxtaposed with the Great Pyramid. There is a perfect alignment by way of a single sun ray going down the great pyramid Queens chamber South shaft,  having the same angle as with the ray touching Akhenaten's crown symbol called the Uraeus.  


This seemingly impossible coincidence, between badly damaged Boundary Stela B single sun ray alignment is simply astounding. There was no software manipulation at all achieving this image, the Queen Chamber South shaft and Uraeus sun ray simply matched straight from the internet.

There is a very low probability for this alignment to ever happen by chance. However, there is an astronomical reason for this link. It was from an Ancient Egyptian coronation ritual practiced 1000 years apart. These coronations can help calculate a solid date, given that we have another sun angle for Akhenaten’s ascension day, tentatively crowned November 22 1313 BC. 39 years earlier than the official chronology.

Certain sun and Sirius positions in the sky inspired the very architecture of the Great Pyramid. It also provided by chance a general but much more focused construction period for the Great Pyramid as well.

The very altitude point in the sky when Sirius and the sun existed at the same level was the day when the RA coronations took place, this was the very reason for the South shaft angle found in the Great Pyramid Queens chamber. As Akhenatens Uraeus sun line strongly implies.

I’ve calculated, with the help and suggestions from a good friend, the construction start year for the Great Pyramid, 2370 BC, a year almost exactly in between the standard Chronology 2570 BC and the GP carbon dating multiple sample results of 4150 BP. The Great Pyramid was built in the age of Aries having a vernal equinox sunrise. This calculation is a very close approximation with a little margin of error.

To inspire further research, I have written two essays, one for each era, which need publication in an interested science journal. I can’t publish in a peer review journal at present because of resources not easily accessible in the Arctic. I am currently trying to find a partner co-author, it is a difficult almost impossible process given my isolation. Failing to find a journal willing to publish, these essays will be eventually read here, unfortunately not the greatest readership impact. Unable to have leveled higher resolution pictures, precludes acceptance to a journal. Because they can be made or exist and publishers like the best quality photos. High quality images also reduce the probability of error to a minimum. A small solace to ease the coming formidable doubts in the well established ancient chronology authority which will provide extremely stiff resistance, most likely ridicule, to stop any changes from happening at all.

Example of what an extensive warming period can do

The Pyramid civilization collapse has happened 200 years or so after the construction of the Great Pyramid. A lot of what was gained in technological advancements, much improved from or coming from the great man of science Imhotep, was lost.  A massive intermediate period of famine with enormous chaos and destruction was the cause.  Undocumented wars surely happened, enemies, without or within the climate affected countries always attacked their foes at their weakest moments.

The Great Pyramid was an awesome accomplishment. It also offers the best example in human history for showing the ravages from Global Warming as opposed to what can be accomplished when we do not waste resources on repairing climate driven disasters . Ancient Egypt went from eventually experimenting with pyramids having large stones, to accomplishing a few huge ones at Giza, seemingly perfect, then not long after,  totally forgetting the techniques achieving them.  The subsequent greatest structures were of mud brick,  carved on or inside hills  or with recycled stones from looting previous constructions.   


      The world today would be very different was it not for a small but significant climate warming periods devastating North Africa.   What will happen to us with the ongoing super big global warming might be quite similar, despite our vastly improved technologies in some domains.

Current Ancient Chronology vs Greenland ice cores

In general if there is a colder Arctic, moisture from the Atlantic Ocean tends to flow West to East at a more Southward latitude towards the equator, providing greater cloud cover and of course heavier precipitation to Southern Europe and North Africa. Absent the cold winter atmosphere, moisture rich Atlantic ocean air tends to travel to Northern Europe, leaving North Africa much dryer.

As a good example, at the moment, North Africa has some moisture driven by present colder winter

MIMIC-TPW  ver.2   March 13 to 17 2023,  Total Precipitable water,  we see the source of water for the Nile from the East,  and also in particular the cloud source for Northern Egypt,  from the West.  This is what a cold Arctic atmosphere does to North Africa.  

 Greenland ice core temperature reconstruction.

During ancient history, there were great droughts, one in particular , namely during the famous first intermediate period, according to present chronology it was 2183 to 2060 BC. Officially on this GISP2 graph, it was a cooling period.

Another one, here we see 2570 BC in the middle of a significant warming trend, not necessarily a drought driven period (I have not read about a drought during the first 3 Ancient Egyptian dynasties) but it was not a wet period. Gisp2 graph 2370 BC had a more stable temperature period, likely when a lot of resources were not spent on survival,  but rather on some construction projects. There are other examples of interest to pick at. But lacking a high precision chronology history, makes ice core analysis somewhat tenuous.


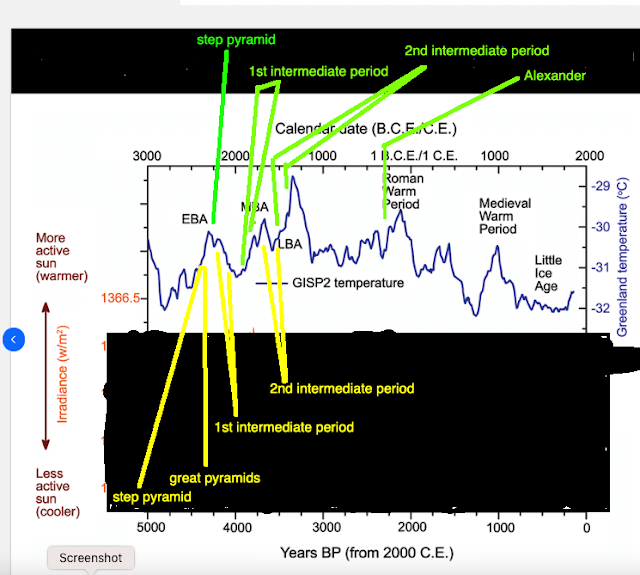
Ancient Chronology in yellow,  does not make any climate sense,  Prior to about 1000 BC,  devastating droughts of the 1st and 2nd intermediate periods occurred during prolonged cooling trends.  The archeo astronomically calculated  corrected timeline (in green),  shifting the Great Pyramids 200 years earlier,   appears far more apt.    Alexander the Great timeline is not modified, the chronology seems more precise going forward in time from that point, but what we see here is a pattern.  War or civil wars comes about a lot during the warming periods.  The said Zenith era of Ancient Egypt ,  from 18th Dynasty pharaoh Hatshepsut onwards was during a cooling period following a  2nd massive intermediate warming era which ended in  wars.    

In these warming days with extreme and well documented climate and weather disasters, it is imperative to understand the historical repercussions of a warming world more than ever. WD March 15-16 2023


Age of Great Pyramid.    Great Pyramid  .   Ancient Chronology correction  .  Ancient Chronology is wrong  . How old is the Great Pyramid?  .  Corrected Ancient chronology  .  Proving age of Great Pyramid  .  Queen Chamber  .  King Chamber .  Why are the shafts sealed?   Orion belt  .  Cosmic journey through shafts  .  Hieroglyph in Great Pyramid  .   Giza  .  Giza plateau .  Great Pyramid of Giza .  Sirius alignment .  Sirius theory .    Atlantis is Egypt  .   End of civilization .   Civilization collapse . Great famines .      Who built the Great Pyramid of Giza and why?  Pyramids of Giza . Great Pyramid of Giza  . Latest discovery Great Pyramid of Giza  .  Great Pyramid of Giza facts .  How long did it take to build great Pyramid of Giza  .  When was the Great Pyramid of Giza built?   Pyramids of Giza . 

Sunday, March 12, 2023

Kennedy Channel the new super highway of broken sea ice, absent Nares Strait long existing circular frozen floe edge let alone a very important ecological ice bridge

~Nares Strait circular floe edge stemming from solid steady sea ice use to form earlier than November,  can't see it now during the coldest of winter

~A very ancient once, very important for wildlife and people,  steady ice bridge does not seem to form as well 

 December 1988 ,  the very noticeable circular floe edge between Northeast Ellesmere and Northwest 'Greenland in Nares Strait,  Kennedy Channel is Southwards the flow of sea water goes towards Kane Basin:

                    1988 December 8,          notice the ice bridge just here -------^^^^,  it was the traditional crossing  point for Inuit spanning centuries.  Who did cross the last time from memory in the 90's.  Was nice to have visitors from Qaanaaq Greenland cross over,  and even an adventurous Canadian from Ellesmere for a visit to Greenland.  A wildlife critical crossing point.  If it exists now a days....  its been so long since I have seen it,  I almost forgot it,  I doubt it does exist,  but if it forms,  it lasts a far shorter time span than prior to 25 years ago. 
  
 In 1850, famous in the Arctic Qitdlarssuaq ,  Qillajuaq,  the Inuk shaman  from North Baffin Island,    mainly the Pond Inlet area,  crossed the ice bridge,  not once but at least twice. with many followers, Canadian Inuit re-introduced the kayak along with other top notch Inuit  technologies to local Greenlandic Inuit.  The trek was legendary,  
    [same photo zoomed]   Back to the ring of circular floe edges,   it was essentially caused by the 
flow of sea water, broken by tides and current.  The ice surrounding it was similar to fast ice,  not moving,  and thick, a large ice shelf spanning from Ellesmere to Greenland,  totally blocking pack ice from the Arctic Basin to escape South. 


  Now look at this:

    Polarview January 17 to March 6 2023, at coldest winter minimum temperatures,  as if the circular ringed floe edge never existed.  


February 28 to March 4 2023,  sea ice is hemorrhaging Southwards,  the  once circular floe edge merely demonstrated how thick and consolidated sea ice was,   It's in transition towards extinction,  causing
reverberations throughout the Arctic. 

OK  further astounding proof:


              November 14 1988


November 07 1988
                                                               
July 22 1988 ,  Kane Basin fast ice bridge,.   Fast ice is frozen ice from open water attaching to land, from 1987-88 winter past,  surviving in July!

                July 17 1988,  no longer Nares Strait rings but an open floe edge surrounded by steady sea ice 

                                               July 11 1988,  Kane Basin fast ice ice is not pack ice yet.   

                                How much this world has changed!

 WD March 12-13 2023


Monday, January 2, 2023

Ultra precise long range temperature forecasts, Possible, likely only with 360 degree thermally balanced observation sites.

 ~The focus on improving Global Circulation  Models need be twinned with perfecting observation sites.  

 ~Near refraction observations have basically demonstrated wide variations in thermal profiles within 3 km radius from station center.  

~  These variations are caused by local,  natural  or not,  variable thermal topography easily causing wider surface  temperature variances,  making longer ranging  predictions almost impossible at unbalanced sites.

  Well known for failing often 6 to 10 day NOAA temperature forecast predictions,  no need to add longer range in a few months or so *Climate projections ,  they are worse.   It is likely not the models fault,  but rather the observation site measurements greatly prone for chaotic changes by very local effects.  

   Many years local near  refraction measurements never made much sense,  here in Southwestern Cornwallis Island Canada,  they rarely match optical refraction theory.  A demonstration can be made on request.  However finally,   after careful analysis ,  they match infrequently.   This is because Cornwallis Island Nunavut is surrounded by 4 different Straits,  having 4 different ice fields or depending on the season,  daily changing open water configurations.  The topography is also mixed,  from plateau 200 meter above sea level,  higher to where the observation site is,  46 meters ASL,  next to adjoining sea level  gravel beaches some 3 km away.  

    This means that locally funneled winds may carry greater influence by either of the said sea Straits ,  or these same winds may be curbed in mesoscale eddies,  not at all having identical thermal nature as direct winds coming from a larger circulation macro scale.    Therefore it turns out that optical near refraction data,  as explained by measured lapse rates,  or by any given day modeled temperature profile,  almost never match theory.  Or does so by an incredible,   about less than 10% of the time  (more precise data forthcoming).    In other words,  this observation Cornwallis site in question,  is very poor in representing the major temperature event of the moment.  

    I have no doubt,  thousands of observation sites used for models all over the world,  give identical results.  

    It is therefore not wise to use thermally imbalanced weather station sites,  for determining model accuracy,  but rather the focus should be on comparing model forecasts at sites which have no local thermal perturbations baked in their topography.  

    The best sites would be:  A buoy in the middle of the Atlantic, or a large lake, a station in the middle of a flat prairie without any major thermal altering sources,  something at a great distance away from a chaotic interfering geographical or fauna feature capable of changing the local  thermal weather pattern.  In the Arctic,  such sites are possible,  not common,  however there is always a lake, a river or a mountain about,  temperature variances may easily change a few hundred meters away.  

     Wherever possible,  identifying thermally balanced stations may help elucidate the real precision of weather models,  I expect them to be very good,  but trying to match temperature predictions with thermally unbalanced sites would be more ideal,  only after  determining the models precision capacity with observation locations as thermally balanced as possible.   I wont be surprised if the 6 to 10 day temperature forecasts are much more precise at such measuring points.  WD January 2,  2023


Sunday, November 13, 2022

Ice on Mars equator, rather permafrost is everywhere on the red planet, Eh2r success story, bad news for another theory though.

 ~First suggested here 8 years ago,  permafrost was detectable without drilling on Mars.  

  On BBC recent report you can see meteorite crater confirm ice below ground:

https://www.youtube.com/watch?v=mg95vY10WSo

of a news article already almost a year old:

https://www.nytimes.com/2022/10/27/science/mars-meteorites-impacts-seismic.html


  .....   only confirms what EH2r research has discovered years ago:

https://eh2r.blogspot.com/2018/12/mars-insight-landing-spot-suggests-not.html

and here some 8 years ago:

https://eh2r.blogspot.com/2015/04/how-to-find-underground-frozen-water-on_25.html 

   It is gratifying to realize that no digging was needed by humans,   Mars surface is unlivable,  but by just watching, observing, something we refraction researchers do all the time. 

        Refraction studies do overlap or very closely resemble space time studies.   Of which Dark Matter or Dark Energy,  has a huge observation problem,  we don't see any hint of this huge content of theoretical mass.  Of which gravitational lensing,  ably explained by Einstein equations,  was confirmed by a solar eclipse.  Dark matter and energy has no such equivalent.   Consider all the trillion stars covering our sky,  the very minute exact position they maintain,  never changing position in the slightest,  despite the observer,  ie any telescope on earth or in space,  constantly moving through space.   Many stars should be slightly moving ever so now and then,  given the massive presence of Dark Matter.  

      In light of this EH2r Mars successful permafrost observation confirmation,  and the power and dominance of -observing- in science,  I don't give much time for the Dark Matter and Energy theories not to be considered plausible in the very least.....WD November 13, 2022.  


Saturday, September 3, 2022

Major shift in Sea Ocean Warming affecting everything


 ~Extreme warning of North Atlantic and Pacific part of,  or cause of ,  or part & cause of worldwide major climate shifts.

~  With some positive effects,  in part saving Arctic sea ice from utter decimation from the clouds they create.

~While negative consequences are documented in nearly daily extraordinary weather catastrophes

  I believe that this recent NOAA sst anomaly map explains it all.  A powerful La-Nina has had a hard time forming,  Arctic sea ice has had a hard time melting more as it should and the major pressure position patterns of global circulation,  all got flummoxed,  thrown out the comprehension window,  because we are now literally in a new climate age.  The one with near permanent warmer ocean regions.   As expected by EH2r projection, Arctic sea ice melt was greater than last year,  but nowhere near 2012 all time low extent minima.  As expected the AI weather outlooks came through,  nice for a change,  except for more rain in some regions,  this can be easily explained by warmer ocean sea surface temperatures,  not so easy to describe their location causations,  near permanent hot zones,  in the past usually with greater degree of variances:


  We remember variation of sea surface temperatures still during a recent warming time,  but in retrospect,  even in 2013 the emplacements of near permanent warming ocean regions were starting to be in place.  

     So now,  we must consider the new world weather order,  in the recent past, so much often eagerly denied by climate skeptics, surely presently not eating humble pie,  face saved by being in this age of many people choosing whom to believe,  rather than deciding or trying to find out what is really going on.  The images such as above,  need no rocket scientists to explain.  WD September 3,  2022


Sunday, June 26, 2022

STABLE; why the Cold Temperature North Pole matters

 ~At any given day of the year the CTNP is the prime circulation mover

~Where all weather systems spins around it

~When it is weak,  hardly anything moves

~This highlights the importance of Arctic sea ice,  the world would be dramatically different without it.

Look carefully at GOES 16 IR system movements,  over Cuba and Gulf of Mexico the weather seems steady for a period of 2 days,  however over Hudson Bay the weather systems move a little more consistently Eastwards.  The further away from the CTNP the slower the circulation,   therefore this weather, as forecasted beginning of May here on EH2r,  has come through as expected.

   Of which June 26 center of coldest air in the world is :


In the SE quadrant of Russia side of the North Pole,  as far from Florida as it gets,  this center wobbles
like a top on top of the world.   Influencing a temperature differential of far lesser  importance than during winter,  30 Centigrade less important while during winter this surface temperature difference is in excess of 60 C.   The weather systems slow move during summers,  giving either greater droughts or floods wherever the systems stagnate.  Absent sea ice the situation will be very much more severe,  Therefore a New World Weather order is rising,  not on Earth in millions of years,  when nothing much will move during summer,  causing the most severe extreme weather most humans may not desire.  So far sea ice is on schedule to be even less prominent,  slowly ,  summer by every next summer,  with the known consequences experienced all over the world.   WD June 26 2021


Sunday, June 12, 2022

Arctic Basin switchover time , about to happen very much on schedule

~Sea ice melt pond data is scarce,  but from long presence of Gyre Anticyclone it is assumed that there are many
~The effects of about to disappear circulation will be compounded by the effects of the coming one

CMC June 12 12 UTC surface prog:

 The sliding of the North Pole cyclone to the Arctic Basin Gyre location seems apt to be more permanent.  

The repositioning of the CTNP's poised to be at the Pole except for North Alaska,  which will get a North Pole Upper Air flow,  all indicate a near permanent Cold Temperature North Pole at the North Pole... 

Melt Ponds are a key factor determining the extent of melt damage done to sea ice early on the melt season.  They are hard to detect,  but this can be done indirectly:

   The black spots on on JAXA/ Bremen AMSR2 have likely melt ponds.  especially twinned with snow depth:
June 12 Climate Reanalyzer  snow depth seems to infer melt ponds pretty much along the coasts devoid of snow.   Although  radar PV photos are more nebulous:


June 10 North of Inuvik Beaufort sea nebulous cloud haze like image seem to indicate wide area of melt ponds.

     As far as sea ice is concerned,  the Low pressure over Arctic Ocean Gyre will shape the over all sea ice melt picture pretty much as I expect,  however slow sea ice extent seems to vanish is an illusion of sorts, the damage from the long presence of anticyclone allowing more sunshine was done,   any further massive storm will bring out near future fissures and exacerbate the melt process further especially late July.  WD June 12, 2022


Thursday, June 2, 2022

Rogue Vortice special Real effects

 ~As the pressure switchover looms,   the Polar Vortex fades in grandeur

~But as such many Rogue Vortices are created

~One May 31 Rogue gave some special effects


A Typical GOES satellite Infra Red picture loop,  May 31  2022 look at the center cloud circulation,  towards the South East,  nothing much to look at.  Until you look at the surface prog,  turns out the clouds are turning the wrong way:

Red X marks the spot,  the surface isobaric flow opposes the movement of clouds.  But the culprit is a Rogue Vortice from the ever shrinking Polar Vortex:

This Vortice is breaking away from the amorphous mangled Polar Vortex really centered in the Canadian Arctic Archipelago (CAA) , this Labrador Vortice  at center is -10 C quite cold for this time of the year.   Again from a sign that the North CAA Cold Temperature North Pole is not done yet:

June 2 2022 700 mb -26 C over Cornwallis Island ,  quite cold CTNP,   The switch over is not in yet,  still on sched,  because its so cold there, for about mid June.  Note the -10 C Labrador Vortice gone,  because Rogues don't last long but their effects give lasting memories.  WD June 3 2022


Saturday, May 21, 2022

EH2r Projection bang on, Arctic Basin Pressure switchover appears to be late

~Apparently not many are aware of this precision in predictions way in advance.
~But then again nobody uses the sun disk as a thermometer, hopefully in time this will change
~Eh2r predictions from multiple observations is looking really good,  in all aspects except for sea ice extent
~Nevertheless its exciting (for at least 30 followers)  when a deep Arctic circulation system is understood,  in essence Arctic temperatures dictate all weather movements Southwards 


18 UTC CMC surface prog May 6 (1025 mb High over Arctic Ocean Basin), 18 and 20, 2022,  look a likes.   to this projected May 1:


Eerily similar isn't it?      The main player is the giant C  in purple,  the Cold Temperature North Pole of the Polar Vortex.   Is cold,  but small,  but really cold:
  CMC 700 mb May 21 at 1200 UTC,  -30 C over Eureka,  Ellesmere Island Canada, wow that is cold but covering a small area.  However this fuels a stable surface High pressure over the Arctic basin,  but soon,  about mid June a dramatic pressure system switchover will occur,  a Low pressure will replace the Arctic Basin High pressure,  because,  Eureka will be very warm!  Last few years this projected switch came earlier.  The present steady circulation picture,  implies vaster areas of sea ice melt ponds,  spelling doom for it,  which seems to be fairing the usual bad,  but not a terrible melt pace yet,  again this will look much worse come late July,  worser than last few years.  Even if persistently cloudy,  and so goes the sea ice non recovery,  whereas climate is totally a key player.  The unstoppable Arctic warming continues even during LaNina period,  usually implying a cooling to take place,  but foiled again by Greenhouse gases.  WD May 21 2022


Monday, May 2, 2022

Very rare coincidence? EH2r projection in sync with most models.

 ~Sometimes AI gets it right

~EH2r projection just made in previous article really close to NOAA model even the Alaska bit


NOAA June July August  summer outlook,  amazingly in sync with EH2r summer 
projection,  in essence a wet SE USA and very hot Western USA,  along with little bit of Alaska.  
If there is no significant seasonal Arctic summer of old,  ie,  a much warmer Arctic,  there should be
very little circulation further South.  This implies the US desert weather to expand, also with practically Synoptic transport of moisture from the Gulf of Mexico, alleviation of super heating by reason of cloud cover.

   But not is all perfect with mega computers:


This AER May forecast misses the recent  CTNP ,  Cold Temperature North Pole hovering about the Canadian Arctic Archipelago and the one existing North of central Siberia,   nothing is perfect  for AI, almost  human,  but to contrast,  human intuition trumps millions of calculations per second,  almost every time.   WD May 2 2022