~There were Cyclonic incursions in the past , but there was more sea ice thickness
~Density Weighted Temperatures of the Northern Hemisphere undeniably demonstrate a warmed planet especially since 1998
~There is no sun over the Arctic yet we witness no "IRIS" effect when the planet is at its warmest
First we look back to late 1980 when the multi-year ice was very thick:
It was a warm Christmas over Siberia in 1980, much warmer than over the Canadian Arctic.
600 mb temperatures courtesy NOAA are very close to the Density Weighted Temperature (DWT) of the entire troposphere. Temperature picture December 26 (left) was not much different compared to December 29 (right), The Polar region in total darkness coldest air morphed a bit but everywhere temperatures of the entire atmosphere was colder than -20 C while in the Canadian Arctic as cold as -40 C almost all the way to the North Pole. DWT 's clearly show the center of the Polar vortex, where all Northern Hemisphere circulation driving winds turn counterclockwise around it.
El-Nino 1998 was strongest, likely stronger than 2015 to date, already we see the circulation pattern markedly different same December 26-29 comparison with 1980. Note the beginning of a Cyclone affecting the DW Temperature profile of the atmosphere about Iceland on December 29.
In 1998 the sea ice started to decline in thickness and extent. Its a marking year. Winter was still
strong during the holiday season. Day to day variations of DWT's were very reasonably predictable and not dramatic.
El-Nino 2015 is similar to 1998, except for a larger warmer sea temperature anomalies for the North Pacific. Yet December 26-29 DWT image is staggeringly different, as well as sea ice thickness and extent:
The gradual but rapid decrease in sea ice thickness since 1998 has had a major playing role decreasing the build up to winter.
From December 26 to 29 2015, the entire Arctic atmosphere significantly warmed in total darkness! An important Low pressure system, one following many, easily penetrated the North Pole region which had DWT temperatures usually close to -40 C, now more like -8 C, again this is the temperature of the entire atmosphere not just the surface, in the past not changing fast in a matter of days. In total -no sun - darkness the usual pattern was stable DWT's. Another marked feature of current 2015-16 season is this darkness warming, never readily noticeable in the past, as winter progresses it usually gets colder not warmer! Now we noticed with ease warming bursts at least 3 times since November 2015. The Cold Temperature North Pole (CTNP) and Arctic has warmed significantly since 1998. This allows Cyclones to penetrate a weakened state of winter which is made in great part in the Arctic, this affects weather world wide. But now, this is new, we witness temperature warming surges causing incredible dynamic changes undoubtedly which will continue to cause tremendously different weather scenarios, some good for warm temperature lovers, but will cause many severe stressful events for human infrastructures as much as on all ecosystems.WD January 2, 2015
Saturday, January 2, 2016
Tuesday, December 22, 2015
Record shattering solstice temperatures causation: El-Nino? No . AGW ? No. Warming seas less Arctic sea ice? No.... All three? Yes
~World wide warming strictly attributed to El-Nino is quite misleading
These winter solstice headlines:
UK:
Record-breaking warmth on Christmas Eve? Here's where
These winter solstice headlines:
UK:
Winter solstice 2015 may be as warm as this year's summer solstice, Met Office says
USA:Weekend Warmth Breaks 142-Year-Old Record Across Eastern US
Canada:
Record-breaking warmth on Christmas Eve? Here's where
France:
All these and more countries report very warm beginning of winter weather.
NOAA also recorded warmer weather for much of the Arctic, China/Mongolia Finland/NW Russia. And the Spitzbergen NE from Greenland area.
Most TV reports cite El-Nino as the single cause for this warming. Which is only a partial factor of attribution:
NOAA US mean El-Nino temperature anomaly during winter profile looks mot much like the current US temperature anomaly map as presented on the previous figure. If Arctic sea ice is thinner
with the oceans warmer, the jet stream would bend elsewhere, as it does, giving a different anomaly result.
The met office worldwide El-Nino warming tendency, also does not look like the current temperature anomaly presented above on top. Especially for NW Russian and Eastern North America and China anomalies.
It is more reasonable to attribute this warming to a synergistic mix from well known causations .
None can stand alone as the single attribution for these solstice events. But, thinner sea ice, warmer oceans (not only in the equatorial Pacific) and the warmest year in history:
NASA GISS D-N +.84 C for 2015, exceeds 1998 +.63 C despite 1998 being as strong or stronger El-Nino than current 2015
. On top of that, the Northern Hemisphere NASA GISS D-N is a staggering +1.1 C as opposed to 1998 +0.71 C.
This article is for TV Met presenters to be a bit more researched, before they blame one cause or another for a mega event. The most truthful simple statement would be:
The world is warming.
wd December 22, 2015
Tuesday, October 13, 2015
Pack consolidation confirmed one month late
~Sure sign of consolidation, winter has started for the Northern Hemisphere
Temperatures colder than -15 C at the North Pole Area yesterday October 12 2015,
these are ripe temperatures indicating a complete freeze up of the Polar pack surviving last summers melt. Most leads are frozen, new ones from sea ice movement freeze relatively quickly. This North Pole anticyclone likely spawned by one large frozen pack like a Greenland High but at lower altitude, indicates the beginning of winter which will spread Southwards more slowly except for Canada, because of warm open sea water surrounding the pack. Winter begins with a lot of resistance. wd Oct 13 , 2015
Wednesday, September 23, 2015
All long range weather projections must consider Sea Ice extent to be correct; April 19 2015 forecast comes through in September!
~El-Nino cooling great parts of Eastern North America did not happen.
~If only sea ice extent projections were just as easy as long range projections with a paper and crayons.
April 18 Sketch of August September circulation, part of my yearly long term projection based on refraction techniques and other means. In Green is the jet stream.
A look at this 250 mb GFS jet stream map:
Makes it so on September 23. A very warm summer continues past the autumn equinox, largely because the cold lost a lot of its source, the summer Arctic Cryophere much reduced to Greenland and very much less sea ice than usual at this time of the year.
The image of no Arctic sea ice at all during summer would leave Greenland as the center of the polar jet stream, this would affect weather incomprehensibly strange except for UK and Ireland with loads full more rain, but everywhere else would be weird. Although not there yet, lack of sea ice like September 2015, gives us an impression
contradicting normal El-Nino summer just past expectations :
"Although the primary effects of El Niño will likely be restricted to temperatures and snowfall in Central Canada, there could be a number of indirect consequences, such as lower grocery prices due to increases rainfall in California and a better growing season."
The weather Network model got it wrong:
NOAA past 90 days demonstrate the "below normal" Weather Channel projection was off, largely because its an El-Nino based forecast. Very little consideration is usually given to sea ice extent with respect to these outputs.
The apparently thorough WN essay had not one word about sea ice.
A neat current weather article of all places from Gawker:
Breaks down this end of summer extension extremely well. In particular looking at CPC's outlook completely turns the tables on the Weather Network weather projection.
To all those who try, be weary about making weather projections without considering the Polar Cryospheric prognosis.
If only sea ice extent numbers were just as easy to predict. But Global weather is changing fast, faster perhaps than anyone with experience can be useful, because geophysical patterns are becoming unconventionally changing with increasing Global Temperatures. WD September 23, 2015
~If only sea ice extent projections were just as easy as long range projections with a paper and crayons.
April 18 Sketch of August September circulation, part of my yearly long term projection based on refraction techniques and other means. In Green is the jet stream.
A look at this 250 mb GFS jet stream map:
Makes it so on September 23. A very warm summer continues past the autumn equinox, largely because the cold lost a lot of its source, the summer Arctic Cryophere much reduced to Greenland and very much less sea ice than usual at this time of the year.
The image of no Arctic sea ice at all during summer would leave Greenland as the center of the polar jet stream, this would affect weather incomprehensibly strange except for UK and Ireland with loads full more rain, but everywhere else would be weird. Although not there yet, lack of sea ice like September 2015, gives us an impression
contradicting normal El-Nino summer just past expectations :
"Although the primary effects of El Niño will likely be restricted to temperatures and snowfall in Central Canada, there could be a number of indirect consequences, such as lower grocery prices due to increases rainfall in California and a better growing season."
"The forecast isn’t so sunny for Ontario and Quebec, where Scott says temperatures are expected to be cooler than seasonal norms overall.
Both the Prairie and Atlantic provinces are forecast to see summer temperatures within seasonal averages, with Alberta trending slightly warmer."
The weather Network model got it wrong:
NOAA past 90 days demonstrate the "below normal" Weather Channel projection was off, largely because its an El-Nino based forecast. Very little consideration is usually given to sea ice extent with respect to these outputs.
The apparently thorough WN essay had not one word about sea ice.
A neat current weather article of all places from Gawker:
Breaks down this end of summer extension extremely well. In particular looking at CPC's outlook completely turns the tables on the Weather Network weather projection.
To all those who try, be weary about making weather projections without considering the Polar Cryospheric prognosis.
If only sea ice extent numbers were just as easy to predict. But Global weather is changing fast, faster perhaps than anyone with experience can be useful, because geophysical patterns are becoming unconventionally changing with increasing Global Temperatures. WD September 23, 2015
Friday, July 24, 2015
2015 major melt contributor: lack of snowfall during preceding winter.
~Snowfall accelerates sea ice refreezing process
~Lack of snow increases accretion on existing sea ice while reducing extent at yearly maxima
One of the biggest factors of 2015 melt was the lack of snow driven by a pan-continental Russia to North america flow of middle Russia dry air. In one hand , accretion is greater when sea ice is bare and exposed to Arctic long night sky. On the other, falling snow, colder than sea water , floats and does not melt below 0 C, which is the definition of Arctic Ocean surface temperature in September. In Arctic autumn, snow just floats or appears a bit submerged just under the surface, this stabilizes the sea surface and likely affects water column convection flow, and creates just right conditions for refreezing. I have documented Cryosphere Today mis-interpreting a snow laden sea as ice. But very shortly after, in a matter of days, sea ice set. Little precipitation during the long night also causes, and more importantly so, less drifting snow, which helps ice set much earlier in autumn, or at any other time during the long dark winter.
Looking at this CT Archive retrieval, one would guess 2012 had a moderately greater melt than 2013.
Note the 2012 snow surface cover over lands of NW North-America and North-East Russia. Logic would dictate more snow presence in tandem with more open water over these naturally colder regions, it was so. 2012 Ice surface extent recovered remarkably quickly in no small part because it snowed more.
But look again, 2012 at minima had a great deal less ice than 2013, and not surprisingly more snow on said colder lands in 2012 rather than 2013, despite the inferred warmer weather because of the Arctic Ocean massively open in 2012.
But in 2012, more than any other recent year, this was filmed:
No, this is not ice, not even grey ice, but fresh snow covering sea water. The winds were just right to create this result.
Winds mixed the surface up, and "snow cakes" still lingered on shore and not much further away covering most of the Strait, until the ice set in about 48 hours later. There was no doubt that snow helped accelerating freeze-up.
The lesson for 2015, a dry Arctic winter decreases over all extent, even though the ice, where it set became thicker, because of no insulation above it. From the Great Lakes to Southwards towards Russia through the North Pole lied a greater winter imprint, its lasting legacy is seen here today:
Hudson Bay and Baffin Bay sea ice survives late in the melt season. The imprint of a lesser snow cover has important significance. WD July 24,2015
Tuesday, July 21, 2015
It seems already time to pronounce Bye Bye 2012 record sea ice minima
With a warming El-Nino comes the prospect of more clouds, but irrelevant during warm Arctic Summer because clouds form a whole lot less with much colder Arctic ground and sea temperatures than found further South.
BOM El-Nino 3.0 index finally displays a burgeoning El-Nino after several quiescent activity periods or false starts, from 2011 to January 2015.
1 day apart SST charts july 19 2012, july 20,2015. The North Pacific is way warmer in 2015 as well.
Undoubtedly contributing to a warmer pan-arctic summer. The clouds should overwhelm when the sun will appear lower above the horizon, by end of August.
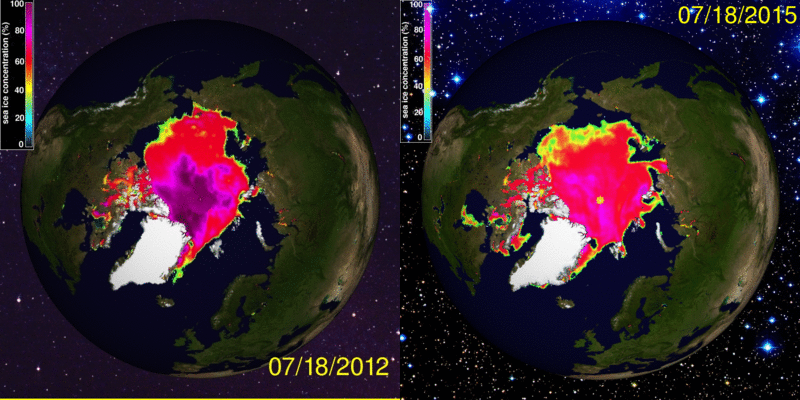
Cryosphere today July 18 2012 and 2015. Arctic sea ice seems right on track to eclipse 2012 record minima, note all the ice in Kara, Hudson and Baffin Bay seas in 2015, remove it, about 300,000 Km2, as it will surely happen, this makes July 18 2015 area virtually tied with 2012 at this moment . Except same date 2015 has huge more expansive water with Chukchi and East Siberian seas, exactly where it matters the most. Beaufort's attributed 40% cover is a bit misleading as Beaufort opened and closed often by the prevailing winds. From now on, the sun will do much further warming than 2012 on Chukchi and East Siberian, way more prominently in tandem with very warm North Pacific waters. Hudson and Baffin Bay current sea ice areas are but temporary outliers and will vanish soon, they are a product of a dry winter just past. Snowfall helps create thicker sea ice, less of it over the winter meant more sea ice accretion from the setting of fast ice onwards, but also creating lesser ice Extent at maxima where the normal Arctic polynyas exist, these helped create a much more earlier ice free NW passage sea route just about to open. The over all outlook is in favour for 2015 to become new standard bearer for all time minima extent and area, it will be quite obvious soon. Late August blitz melting of 2014 was sudden because of very weakened sea ice condition, as we can see, this blitz is occurring -now- almost 1 month ahead of time. wd july 21,2015 |
Friday, June 5, 2015
From Barrow Strait to Barrow Alaska Sea ice gives the same interesting horizons.
After hitting play, place mouse Cursor tip at sea ice
horizon center, leave it alone and enjoy the
shifting. (2007-2008)
U of Alaska Barrow webcam says it all. Even a plain webcam easily demonstrates the shifting horizon between ice "seasons", there are likely more than 11... After watching the video above and or any other well done sequences. You may realize the seasons namely: 1- Pre first fast ice ice ultra low horizon 2-Freeze up horizon , 3- Thin ice ice horizon, 4- Dark season ice, 5- Sunrise horizon 6-Great late winter horizon ice, 7-Great Diurnal shifting horizon ice, 8-"First Melt" astronomical horizon ice, 9- Melt Pond horizon ice, 10- Mixed water and ice horizons,11- open sea water horizons. WD June 5,2015 |
Saturday, May 23, 2015
Dedicated Sea ice model proofing, offering Horizon observations for correlations.
~First ever sea and ice temperature profiles extracted by refraction observations.
~Already helped proving buoy top thermistors measuring wrong temperatures
~It is hoped to be a useful for Sea ice dedicated coupled models.
It has been known that GRIB model can't duplicate exact Arctic Ocean sunset geometry, or not calculate near surface inversions exactly by either failing to replicate an inversion temperature profile or missing to forecast them all together. Mass Buoys also exaggerate the solar warming of its top thermistors, I noticed this when a consistent isotherm was observed a few weeks after end of long night over NW passage sea ice horizon after every Local Apparent Noon. When sea ice horizon elevation is identical to the true astronomical horizon it means that top of sea ice and the air right above have identical temperatures. During Spring from Southern Cornwallis Island Nunavut Canada shores, a stable isotherm was seen lasting from a few minutes during first day it was observed to nearly half a day several weeks later, even when quite cold temperatures persisted. This contradicted buoy data suggesting an adiabatic profile with top sea ice air warmer than surface air at 2 meters.
There is substantial data to extract from horizon observations throughout the entire Arctic year. The following figure encapsulates the main temperatures profiles of sea water, ice and air over the entire year:
Temperature profiles determined by Horizon Elevations can be very useful to check Gridded GCM's. Here is the summary of all phases of sea ice throughout the Arctic year. Some temperature profiles are truncated in order to fit the sketch. It would be desirable to see a similar figure created by a coupled model.
From left to right there are about 9 recognizable horizon elevation changes which stem
from significant temperature changes on part of or the entire temperature profile comprising either two or three different mediums.
Late Summer 74N 95W:
High Arctic surface temperatures may vary between -5 to +5 C. At +5 C there can be a temperature inversion over a sea with sst's not usually exceeding +4 C.
Early Autumn;
Surface temperatures normally vary from -3 to -10 C, it is common to observe the true astronomical horizon when sea surface temperature is equal to surface air.
Middle Autumn;
Is the time when sea water subsists despite colder -5 to -15 C air temps. When the temperature is seasonal minimum cold, the horizon drops to is lowest point of the year.
Late fall;
Fast ice forms usually after October 1, especially during the last 10 years as opposed to early and mid September in the further away recent past. Something spectacular
occurs with the horizon when grey ice starts to be prominent, the horizon is seen very low with open water, and jumps to above Astronomical Horizon in less a day after sea ice completely covers all the way to the horizon, the ice accretes till "first melt".
Early Winter;
With the beginning of long night (early November), the sea ice horizon very slowly rises day by day until it vanishes in the night.
Mid Winter;
Is marked by temperatures between -25 and -40 C with only daily noon twilight for bright light. The horizon is much higher at sunrise from the long night compared to when sea ice first set completely. But there are some variances caused by advection of either cold or warmer air. New ice usually is about 1 meter thick. By mid February, the effects of solar radiation increases horizon elevations even more, especially in the evening, to highest levels until mid-April.
Late Winter;
A surprising view occurs when the astronomical horizon is the same as the ice horizon for the first time since mid October, it is "first melt", when the sun is high enough in the sky to eradicate the very persistent inversion giving horizon continuously above astronomical horizon. "First melt" likely happens at bottom of the ice column, but the horizon rises a few minutes after and the bottom refreezes. Over the last 4 years , "first melt " dates occurred on different dates, 2010 being the earliest. After FM, the sea bottom thaws and refreezes daily. With a gradual progression of longer and longer horizons at same astronomical level, only interrupted by snowfall, clouds or fog, the ice bottom remains more less the same. From this time the ice column warms slowly as well.
Early Spring;
Day by day the Astronomical horizon is achieved at longer and longer intervals.
Post Local Apparent Noon Isotherms subsist right above the ice. The ice rots at bottom.
But in the evening with lower sun in sky, the horizon rises, inversions occur diurnally, and exist from evening to early morning when sunny, they even happen during cloudy periods. The ice column warms more and more, contributing to ice bottom rot. But there is cold ice "middle" core which helps cool the adjoining air faster thus causing the horizon to rise. In time, the cold ice core becomes quite insignificant, the astronomical horizon period extends to nearly all day.
Late spring;
The onset of melt ponds should lower the horizon below astronomical horizon, but the ponds must cover most of the ice all the way to the horizon. If so, an adiabatic profile subsists from top of ice surface upwards. Both top and bottom ice starts to melt. Sea water temperatures increase slowly, necessary to melt sea ice depleted of salt, which has a point of fusion closer to 0 degrees C. A sea ice column may subsist even with temperatures nearest or just above -1.8 C, provided brine has been flushed away. WD May23, 2015
Sunday, May 17, 2015
Sea Ice Thermal Flux Profiles II, as demonstrated by the horizon; thin ice
~A big surprise, very thin sea ice gives a similar horizon to much thicker ice, the instant it is set completely.
~The difference between the two ice profiles help explain thermodynamic action.
Astounding as it sounds, thin sea ice raises the horizon a lot as soon as it forms. Historically, there has been well known weather the day sea ice forms, the clouds clear along with a common impression of much colder temperatures all around coastal areas. For obvious reasons thermal variances are difficult to study when sea water turns to sea ice, although flux studies have been done mainly after sea ice is solid enough to put equipment on it.
Just after Minima of 2013. The apparent Arctic wide cooling caused by extraordinary dynamic Gyre stall of ice compaction over the entire Arctic Ocean (except for the Atlantic side) caused an earlier freeze up of McClure and Barrow Strait. This reduced the usual cloudy autumn from masking the horizon. Above left picture was on September 21, 2013, with surface temperature -6 C. Some ice was already present but sea ice formed further afterwards. Middle picture was September 23, 2013, sea ice appeared to have formed completely and the horizon rose above true astronomical horizon. This is simply an exhilarating discovery, it leaves long wave thermal transfer as the principal thermal contributor of the near surface inversion causing the greater refraction looming. Further to this (extreme right), the horizon remained the same or even dropped a little 2 hours later in the evening. This is another discovery. Usually a thicker sea ice horizon rises in the evening, even when cloudy, a stronger evening inversion did not happen when ice was seen bran new. This lack of horizon rise was observed again multiple times with very thin ice. I suggest an absent sea ice "cold" core which allows the air to cool faster above top of ice, while with new ice the higher sun presence at about noon gave greater thermal flux upwards creating a slightly more visible inversion.
A common problem with very new sea ice analysis is of course caused by fog or clouds. Natural cooling during autumn causes a great deal of moisture obscurations. Fortunately 2014 had a brief respite just about the right time, although not perfect, the photographic repetition of 2013 freeze-up was achieved.
Barrow Strait can be very complicated by its tidal currents which change substantially during a moon cycle. But here we can note the same thermal sceneries as witnessed in 2013, 2012, 2011 and 2009. Capturing a freeze-up with very little clouds is rare. This is why 2014 and 2013 are featured here, the other years had some clouds making demonstrations possible with a lot more explanations. 2014 freeze-up took 3 days, of which day 2 had grey ice which will be dealt with on a subsequent article. Picture of October 1 (extreme left) feature rolling water waves and sea ice bits in a fierce wind storm. Temperatures ranged from -9 to -12 between Oct 1 and 3. 2014 freeze-up occurred at about -11 C which was a return to regular yearly feature. except for 2013. On October 3, Barrow horizon rose substantially despite similar temperatures. 20:07:54 UTC capture (second from left) had new thin ice slightly mangled by winds and tidal currents during its formation. But at once the horizon rose when sea ice covered all of sea water up to the horizon. A few hours later the horizon dropped (23:31:26) again likely due to air cooling faster than top of thin ice. Well frozen with thicker sea ice, the horizon rose most 15 days later (furtherest right). the cold ice core started to to grow enough to affect the evening rise, accretion of ice goes in tandem with a more risen horizon.
Barrow Strait Ice is usually more chaotic than McClure Strait , but concurring to the demo above the Western view of the Northwest passage had similar refraction effects but on different days:
October 2, 4 and 18 2014 (from left to right), sea ice set a day later in McClure Strait and looking at NW passage . October 3 had grey ice. The much lowered water horizon (left) rose at freeze-up on (center), the horizon rose further 2 weeks later indicating the build up of a cold ice core. The repetition of this looming feature helps explain thermal fluxes instantly.
Thin sea ice main feature as giving as high or higher horizon compared with thicker spring time sea ice at noon must be due in large part to thermal long wave heat from the the summer warmed sea causing a weak inversion, convection stops the moment the sea surface becomes crystalline, the insulation properties of very thin sea ice is simply spectacular. Sea ice conduction in direct contact with surface air plays a different role in autumn, likely slightly warming the interface (if at all) as opposed to cooling the snow/ice with air interface in spring especially in the evening. The missing core of cold ice is replaced by thermally "hot" sea water reducing evening inversion amplification. But this feature has been observed to be short lived, one week or so from onset the stable to slightly lowering horizon in evening changes to heightening as a top of ice cold core becomes more and more resilient and effectively cools the interface faster after warming from the autumnal noon Polar sun. Conduction from very thin sea ice appears to be very poor, not powerful enough to warm interface air by causing and adiabatic profile which would lower the horizon below astronomical horizon height. WD May17,2015
Reference:
~The difference between the two ice profiles help explain thermodynamic action.
Astounding as it sounds, thin sea ice raises the horizon a lot as soon as it forms. Historically, there has been well known weather the day sea ice forms, the clouds clear along with a common impression of much colder temperatures all around coastal areas. For obvious reasons thermal variances are difficult to study when sea water turns to sea ice, although flux studies have been done mainly after sea ice is solid enough to put equipment on it.
A common problem with very new sea ice analysis is of course caused by fog or clouds. Natural cooling during autumn causes a great deal of moisture obscurations. Fortunately 2014 had a brief respite just about the right time, although not perfect, the photographic repetition of 2013 freeze-up was achieved.
Barrow Strait can be very complicated by its tidal currents which change substantially during a moon cycle. But here we can note the same thermal sceneries as witnessed in 2013, 2012, 2011 and 2009. Capturing a freeze-up with very little clouds is rare. This is why 2014 and 2013 are featured here, the other years had some clouds making demonstrations possible with a lot more explanations. 2014 freeze-up took 3 days, of which day 2 had grey ice which will be dealt with on a subsequent article. Picture of October 1 (extreme left) feature rolling water waves and sea ice bits in a fierce wind storm. Temperatures ranged from -9 to -12 between Oct 1 and 3. 2014 freeze-up occurred at about -11 C which was a return to regular yearly feature. except for 2013. On October 3, Barrow horizon rose substantially despite similar temperatures. 20:07:54 UTC capture (second from left) had new thin ice slightly mangled by winds and tidal currents during its formation. But at once the horizon rose when sea ice covered all of sea water up to the horizon. A few hours later the horizon dropped (23:31:26) again likely due to air cooling faster than top of thin ice. Well frozen with thicker sea ice, the horizon rose most 15 days later (furtherest right). the cold ice core started to to grow enough to affect the evening rise, accretion of ice goes in tandem with a more risen horizon.
Barrow Strait Ice is usually more chaotic than McClure Strait , but concurring to the demo above the Western view of the Northwest passage had similar refraction effects but on different days:
October 2, 4 and 18 2014 (from left to right), sea ice set a day later in McClure Strait and looking at NW passage . October 3 had grey ice. The much lowered water horizon (left) rose at freeze-up on (center), the horizon rose further 2 weeks later indicating the build up of a cold ice core. The repetition of this looming feature helps explain thermal fluxes instantly.
Thin sea ice main feature as giving as high or higher horizon compared with thicker spring time sea ice at noon must be due in large part to thermal long wave heat from the the summer warmed sea causing a weak inversion, convection stops the moment the sea surface becomes crystalline, the insulation properties of very thin sea ice is simply spectacular. Sea ice conduction in direct contact with surface air plays a different role in autumn, likely slightly warming the interface (if at all) as opposed to cooling the snow/ice with air interface in spring especially in the evening. The missing core of cold ice is replaced by thermally "hot" sea water reducing evening inversion amplification. But this feature has been observed to be short lived, one week or so from onset the stable to slightly lowering horizon in evening changes to heightening as a top of ice cold core becomes more and more resilient and effectively cools the interface faster after warming from the autumnal noon Polar sun. Conduction from very thin sea ice appears to be very poor, not powerful enough to warm interface air by causing and adiabatic profile which would lower the horizon below astronomical horizon height. WD May17,2015
Reference:
Surface energy fluxes of Arctic winter sea ice in Barrow Strait
Sunday, May 10, 2015
Sea ice thermal flux profiles , as demonstrated by the horizon.
~Part 1 , sea water to very thin sea ice
~ An attempt to explain what happens at the sea to air interface when sea ice forms
I was going to demonstrate possible clashing between buoy data and refraction observations. But it is now known that above sea ice Mass Buoys thermistors exaggerate
the snow or air layer temperatures a great deal. Buoy 2015A had 20 cm of snow with temperatures in excess of +7 C, while surface temperatures was +1.48 C (thanks to Jim Hunt for good detective work). It is not impossible for snow surface to be warmer than the air when its sunny. But it is impossible to have snow at +7 C. This obvious flaw asserts questions and doubts about for above ice string thermistors. Moreover this data is lost to what should have been computer Model output verifications. It is a loss which may be compensated by refraction observations.
Simple initial sea ice formation;
Easy as it seems, thermally speaking it is not, we let the horizon demonstrate, but after several freeze-up seasons of observation, the problem was to be sure if the sea ice has been totally covered all the way till the horizon. Any open water affects the horizon line elevation. Arctic sea water is magnificently stable in temperature, so its horizon line varies almost exclusively with air temperature change:
A much lowered horizon is due to "sinking", the surface temperature is "about" 6.2 degrees warmer than air, "about" because the horizon line changes position with the temperature differences between the entire light path which is never measured. The few bits of ice are also miraged.
The most difficult analysis possible is to see what happens when sea ice forms over a wide expanse at once, but what seems fairly certain, there is no ice thickness limit by which the horizon always rises above true astronomical horizon. This seems to be an astounding discovery:
2014 October 3 (left) and the next day. The horizon at left is about 17 km distant, (at right) more than 25 Kilometers away. Mostly water horizon turns to 100 % sea ice. Similar freeze-ups were re- observed in 2013 and 2012. It does not matter how thick the ice is, it will set the horizon above astronomical line as long as the sea is completely covered with ice. But the finer details, from very low horizon of open water under a deep freezing air, to above astronomical when sea ice covers everything, need be carefully studied since it helps determine thermal flux balance in one glimpse. Usually the very low pre-freezing sea water horizon does not last long because the very cold air changes the state of sea surface. Recent years freeze-ups happened because of colder Southern in provenance atmospheric advection , with the exception of 2013, sea water was so warmed air temperatures needed to be below -11 C.
High precision satellite pictures along with a careful analysis of a surface phase change would be quite revealing. The reason for various horizon heights have everything to do with thermal fluxes. As winter progresses, the horizon changes until spring when the sun literally gives a similar horizon look, but for entirely different reasons than at freeze-up. The very low sinking horizon exists because of a very steep near surface adiabatic profile, the raised horizon on account of a completely ice covered sea, is caused by looming by profiles having stable inversions varying in strength based entirely on the current thermal balance. This indirectly identifies ice thickness because
thicker sea ice has a cold or warm "core", significantly affecting thermodynamic action. WD May 10,2015
Subscribe to:
Posts (Atom)