Sunday, February 6, 2022

When coldest of winter starts from the South, the new climate normal

 ~An Arctic perspective use to portray cold winds from the NORTH

~Now cold atmospheres start from the South


Pay attention to the High Arctic weighted temperature of the entire troposphere.  At beginning of January till mid month the coldest air was further South,  then after the Cold Temperature North Poles grew in size,  the coldest temperatures finally settled in the High Arctic.  This climate shift is recent.  Basically implies a warmer Arctic,  on land especially over thinner sea ice.  Still implying the bulge of winter moved Northwards in several locations.  Over the oceans and virtually on every part of the continents,  whereas winter of old still exists but for much shorter time periods.  On the North American side,  the CTNP settling over the Eastern High Arctic give more often than not the warm winter periods of late.    However the less expansive Cold Temperature Vortice centers on each continents make for dramatic weather changes,  which make the news because these weather events are usually out of time and place. WD Feb 6 2022


Friday, January 28, 2022

Don't look UP .... North....... Arctic sea ice in dire straits (literally)

 ~Ridging sea ice against the Canadian Arctic Archipelago hardly exists!

   These are strange days, when denialists and a few microphone Youtube presenters sway large segments of our population to believe in fantasy impressions of reality,  even when evidence,  not little bit of evidence, massive sways of archives occupy computer memory banks, instead of human minds.  

  To help up a few hesitant deniers,  and to encourage them to do their own exploration, hopefully backed the writings of giants (found in any good science book) .  Here is the Canadian Arctic Archipelago,  just NW  of its center,  January 23 and below this for good measure 26 ,  2022,  


    January 23 Polarview picture,  the top one,  looks very distressing,  January 26 ,  same area,  shows some freezing,  which should be extremely strong in Polar darkness,  it doesn't seem so here.  For those who don't know about the Canadian Arctic Archipelago (ie CAA),  I am not surprised,  TV maps rarely depict them correctly:


The placement of 2021/22 on this weather map,  is where the sea ice pictures above come from.   The CAA is portrayed the usual way here,  as something to type over.  Actually its a fairly good TV weather map compared to most.    At any rate,  there was and  is (to a lesser extent) a tidal ridging of sea ice ,  going back millions of years, from the Arctic Ocean basin (the Arctic Ocean) towards the Canadian Arctic Archipelago NW shore,  this ridging and compaction, was, once upon a time ,  intense:


Same location as pictures above, HRPT likely USSR  Meteor,  but can be NOAA,  circa 1989, January 4.  The coastal Arctic sea ice day, was solidly frozen, marked by "tidal' leads, often frozen in a day, looking like hair strands or river channels.  On occasion, as on this day,  a High pressure, massive, heavy, opened up the very thick consolidated sea ice. But water opening never lasted longer than a few days, recognizable by their grey-ish appearance (new ice and fresh snow cover), the big black lead above  had a short lifespan.  Again for good measure we have another archive  picture:


     19 days later,  the huge High  pressure lead can't be recognized,  it almost totally vanished,  but newer "tidal" leads can be seen.     They are created  and destroyed, vanished  and faded daily.  The difference here,  between 1989 and 2022 is obvious,  there is less thick sea ice ridging against the CAA shores,  the 2022 shots demonstrate a summer sea ice configuration,  looser pack,  significantly thinner,  with a lot more open water.  Compare again with a modern same resolution as 1989 NOAA HRPT photo Jan 27 2022:


        Arctic long night sea ice is barely recognizable a mere 33 years later.WD Jan 28 2022

Monday, January 17, 2022

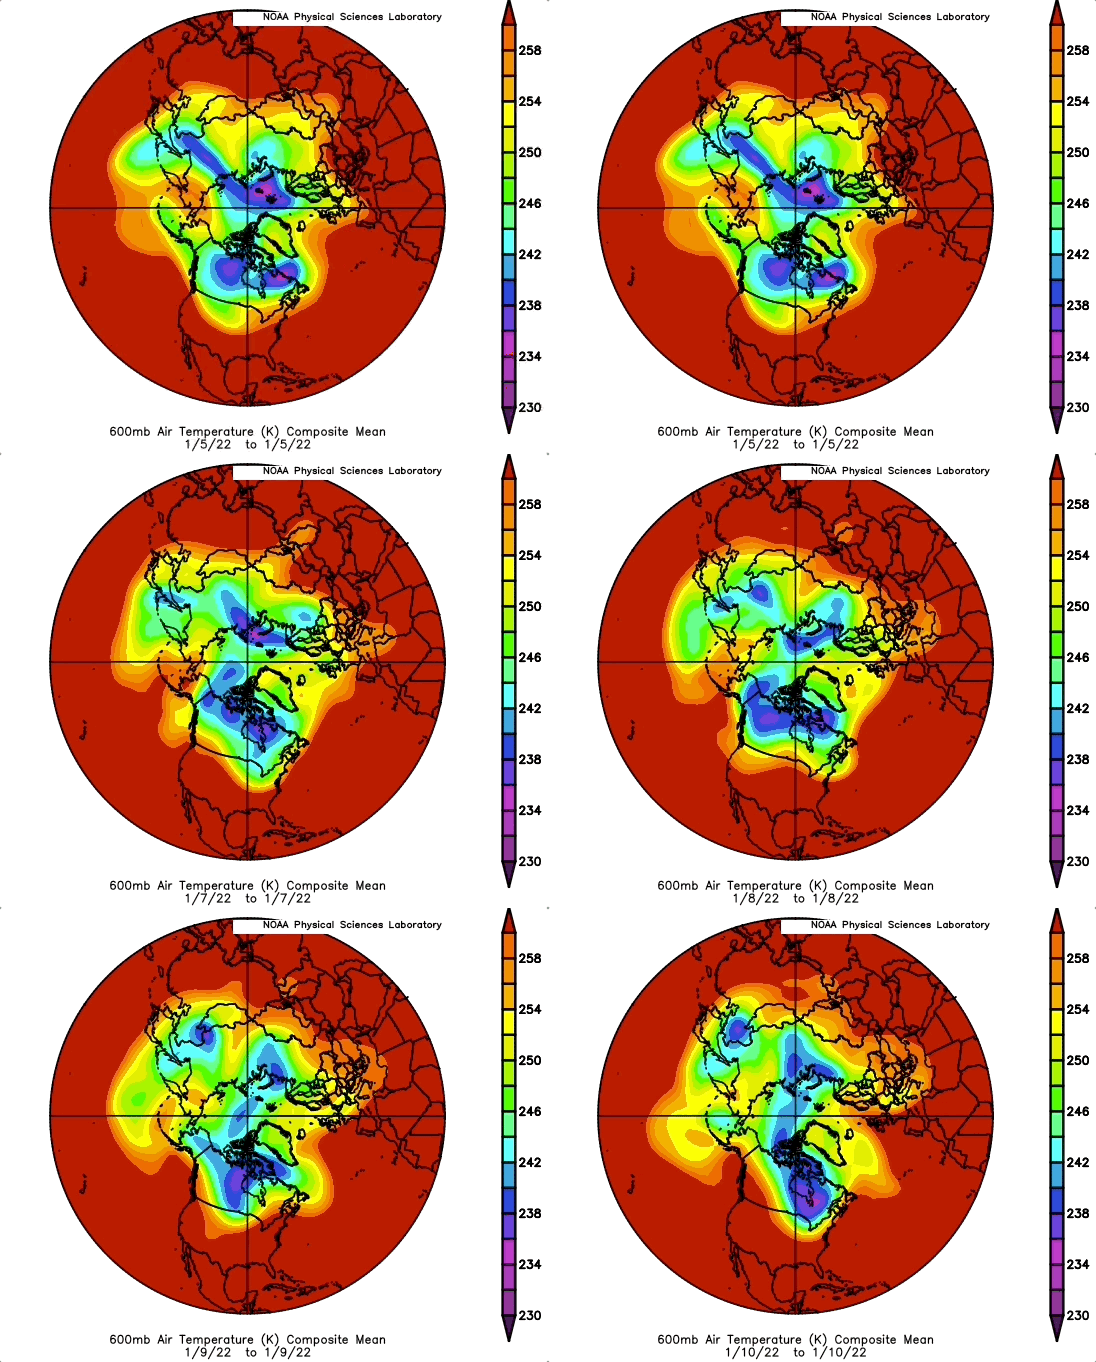
Great Temperate zone in origin FREEZING blast, whatever happened to the Arctic blast? I wonder.....


Last I looked , 65 degrees North latitude was the sub-Arctic,  where most of the cooling action seems to have been created in between January 5 and 10 2022,  but again, the greatest cooling occurred nearly in the temperate North American  zone.    In such the new weather Climate takes shape,  tropospheric Polar Vortex Cold Temperature North Pole vortices form here and there, appear to move rapidly,   or  form and disappear just as quickly,  at the same time, with very steady cyclones and jet stream positions.  And such are the days of transition,  just prior to perineal Arctic sea ice soon becoming seasonal. WD January 17, 2022

Wednesday, January 12, 2022

Shrinking of winter, one year at the time

~The bitter cold "Arctic Blast" isn't as big as it use to be

~Visual proof of Global warming very apparent,  especially when La-Nina periods look like El-Nino


          Winter 2021-22 started small:

In fact millions of square kilometers smaller than 1977,  2016 very powerful El-Nino warming is comparable to modest La-Ninas during  2020 and 2021 as well,  astounding if you think of it.  The only quadrant from North Pole apparently not so much changed since 77 is the Russian side.  Temperatures at 600 mb are more influenced by greenhouse gases and surface temperatures than the stratosphere,  which tends to cool when the troposphere warms.  600 mb is also the closest pressure level to the density weighted temperature (DWT)  of the entire troposphere.  


Latest December mean 600 mb winter temperatures have equally shrunken in extent quite visibly.  In particular in the Canadian Arctic, North Pacific and Atlantic.  2021-22 loss of the Canadian Arctic frost continental wide 'bite" was particularly felt on the Eastern North American coast.  Notably because the extent of cold Polar vortex centers,  highly circulating influential vortices,  are smaller.  It does not mean that smaller vortices are warmer,  they can be just as cold as ever or even more deeply cold.   Cold Temperature North Poles of smaller extent are equally mobile and can navigate the Globe rapidly,  easily making people forget the warm winter they enjoyed so far.  Again it is quite obvious that the new world climate winter order will be dominated by Siberia.  Implying dramatic changes not experienced by humans in many parts of the world.  In particular NW Europe,  the Canadian Archipelago CTNP vortice has huge implications if absent.  Namely the Gulf Stream cyclones can turn Westwards instead of Northeastwards towards Ireland and the UK.  Alaska benefited extreme warming for lack of the Canadian Archipelago bulge as well.  The other large unknown is what will this do to the Gulf Stream itself,  in the long run a significant Atmospheric circulation change also gets to influence Ocean currents.  WD Jan12 2021

Sunday, December 26, 2021

Never so steady polar vortex circulation, strange things happen when nothing moves

 ~Take one day,  any day,  of the recent weeks,  and the weather image is close to the same.

~So much for chaotic weather

   First we observe winter 2021 Siberian Cold Temperature North Pole dominance,  a awe puzzling phenomena, which I have a somewhat good grasp,  but this is the main feature,  we start from there,  but was it always like this?


NO is the answer,  spot check 4 winter days in the not so distant past,  the year when Arctic sea ice was much thicker,  1977,  with Arctic sea ice wedged or ridged against the North American side of the North Pole helped create a colder region than Siberia.  Remember he Canadian Arctic Archipelago, prior to 1947 had very few people living there for a reason,  it was often colder than Siberia.   In this spot check, November 11, 25;  December 9 and 23 at 600 mb temperature, where the average temperature of the troposphere may be found without calculations.  3 out of 4 of these days,  the legendary bitter cold Siberia,  was warmer than the Canadian High Arctic. 


Fast forward 2015,  3 years after the famous 2012 Arctic Sea ice  minima melt,  there was the strongest El-Nino in history,   Siberia appears dominant cold 2 days out of 4,  yet ,  El-Nino was on the American side of the Pole, so this might be ENSO driven.  But recent years observations gradually place Siberia coldest atmosphere of the Northern world during the majority of winter days,  a shift,  largely due to the Northern Pacific and Atlantic being very warmed;


3 out of 4 same November and December days in 2021,  make Siberia the dominant Coldest Atmosphere ,  a huge pattern shift,  Ignore Greenland area,  the atmosphere at 600 mb is greatly influenced by ice, there should be dominance of cold air  at the top of a Glacier especially when 600 mb winds are calm, so a daily record must consider this.   Besides it rained at the top of Greenland this summer past:

 https://www.nbcnews.com/science/environment/rained-first-time-summit-greenlands-ice-sheet-rcna1723    

    Weather wise it has been weird, stranger than usual Global Warming induced changes,  the apparent stability of 2021 patterns have been uncanny,  gave results positive of nicer milder much warmer weather in Eastern North America,  and devastating floods in usually very weather quiet British Columbia.  Contrast the 1977 outline of 252 degrees Kelvin and the 2021,  same days,  weather systems flow around this limit,  which greatly explains why B.C. got a greater injection of extremely warmed North Pacific air.   


Sunday, November 21, 2021

Prelude to the Late Great Arctic Ocean summer sea ice, the writing is in the air

 ~There is a minimal,  but valuable,  effort to measure Arctic sea ice in its 3d nature

~It is about to vanish in summer,  this is one way to  know it:


  October November Canadian Arctic Archipelago Upper air profiles have evolved.  They are more like Southern Canadian ones.  The main reason is the disappearance of sea ice,  mainly now in its thickness.  This allows heat from the even warmer ocean to transform the lower troposphere.  In effect cancelling the build up of winter to a lesser degree of magnitude.  The difference between tropopause temperature and tropospheric maxima has grown,  the tropopause is usually much higher,  the inversion heights from surface have dropped.  But in particular temperature profile maxima to surface lapse rate has shrunken significantly since 2019, indicating a massive warming, therefore thinning of sea ice,  no longer thick enough similar in nature to deep frozen land.   It would take a much larger intense study to confirm how wide scale this phenomena is,  it would take a huge recalculation of historical measurements particular data points from all stations, not readily available on internet, in order to pinpoint exactly when the Arctic summer sea ice will completely melt.  Assessing atmospheric measurements far more rich in data, would make it easier to predict,  the keen  Arctic Atmosphere mirroring current Arctic sea ice state, is a work around way to measure over all sea ice thickness,  but seems it wont be long before it will all gone.  When the High Arctic Upper Air becomes close to resemble the subArctic of the 80's (its warming there as well) , ie Hudson Bay for instance,  we will have a better idea.  WD November 21 2021


Sunday, November 14, 2021

October 2021 total collapse of Canadian Arctic Archipelago cold air build up, never before observed

~Never recorded as such ,  incredible High Arctic warming goes irresponsibly unreported,  although its climate effects will surely be talked about.


IGNORE Greenland,  925 mb air temperature does not exist inside a massive 600 mb high Glacier.   Look at the blue 262 Kelvin  (-21 C) reading especially over the Canadian Arctic Archipelago,  October 2021 gone, despite 2016 ultra warm El-Nino and the much thinner sea ice since 2012,   This will surely make an impression over North American weather further South.  Not that it wont cool,  but the colder sting of dark winter will start very late, if noticed at all.  

Surface air temperatures are again non existent inside Greenland Glacier,  Look at the massive surface cooling effect of thicker sea ice in 1977.  Now thinner,  Arctic Ocean sea ice influence is in steep decline,  no longer builds a more round circumpolar vortex.  These irregular Arctic average temperature shapes are reflected everywhere further South,  thus the wild winter temperature fluctuations of late.WD November 14 2021

Sunday, November 7, 2021

The Polar Vortex Fix; Near permanent Siberian dominance, especially over ENSO's influence

 ~Coming winter will likely be a warm one for North America

~Notwithstanding ENSO apparent LaNina?   

~As far as circulation is concerned the Polar Vortex rules the world

Take nearly any day in October just past and the vortex would look like above,  of which Northern Siberia was/is at the Cold Temperature North Pole (CTNP).  Northern Greenland and Ellesmere Island mostly strangely out of extreme cooling business.  Largely because of North Pacific incoming warm cyclones driven towards West Greenland by the same Polar Vortex,  a feedback loop.    If the extreme Southern location of the P.V. is way up in the High Arctic,  it goes without saying about the warmer weather further all the way South to Florida  

   Here is one Canadian Global News long range winter forecast ,  a fairly descent, standard, run of the mill projection about the coming winter, ENSO dominates the talk,  but the Polar Vortex does the walk...


     The NYTimes did a state of the comprehension, quite good piece on ENSO,  however it almost triggered the writer, Henry Fountain,  to look for circulation pattern causations elsewhere:


......"The changes in atmospheric circulation can result in changes in weather in various parts of the world, what meteorologists call teleconnections. Much of this is related to the position of the jet stream, the high altitude winds that sweep across the planet from west to east.

In El Niño, the jet stream tends to shift to the south. That can bring rainier, cooler conditions to much of the Southern United States, and warmer conditions to parts of the North. Elsewhere, El Niño can create warm, dry conditions in Asia, Australia and the Indian subcontinent. Parts of Africa and South America can be affected as well.

In La Niña, the jet stream shifts northward. That can lead to warm and dry conditions in the Southern United States, and cooler, wetter weather in parts of the North, especially the Pacific Northwest. Parts of Australia and Asia can be wetter than normal.

La Niña can also lead to more hurricanes in the North Atlantic because there is typically less wind shear, the changes in wind speed and direction that can disrupt the structure of cyclonic storms as they form.

It’s important to note that these are just typical effects. El Niño and La Niña sometimes don’t follow the expected patterns.
" (underline by me)

What is more to the point is that El-Nino and El-Nina don't appear to change circulation patterns pretty much already set by winter, or can you tell which of these jet stream average positions between January 1 and April 10 happened during El-Nino or La-Nina? :

   2 were El-Nino , 2016 and 19, two others under La-Nina 2000 and 08.

   Finally recall the forecast presentation ? There is too much certitude over the coming La-Nina, since 2016 ENSO temperatures tended to remain in the neutral temperature zone or at temperatures considered neutral, this was its main routine of late, briefly trending one way or the other never going too extreme. A week or so a La-Nina forecast was in the bag but now:

Not so blue cold.... wd Nov 7, 2021

Sunday, October 31, 2021

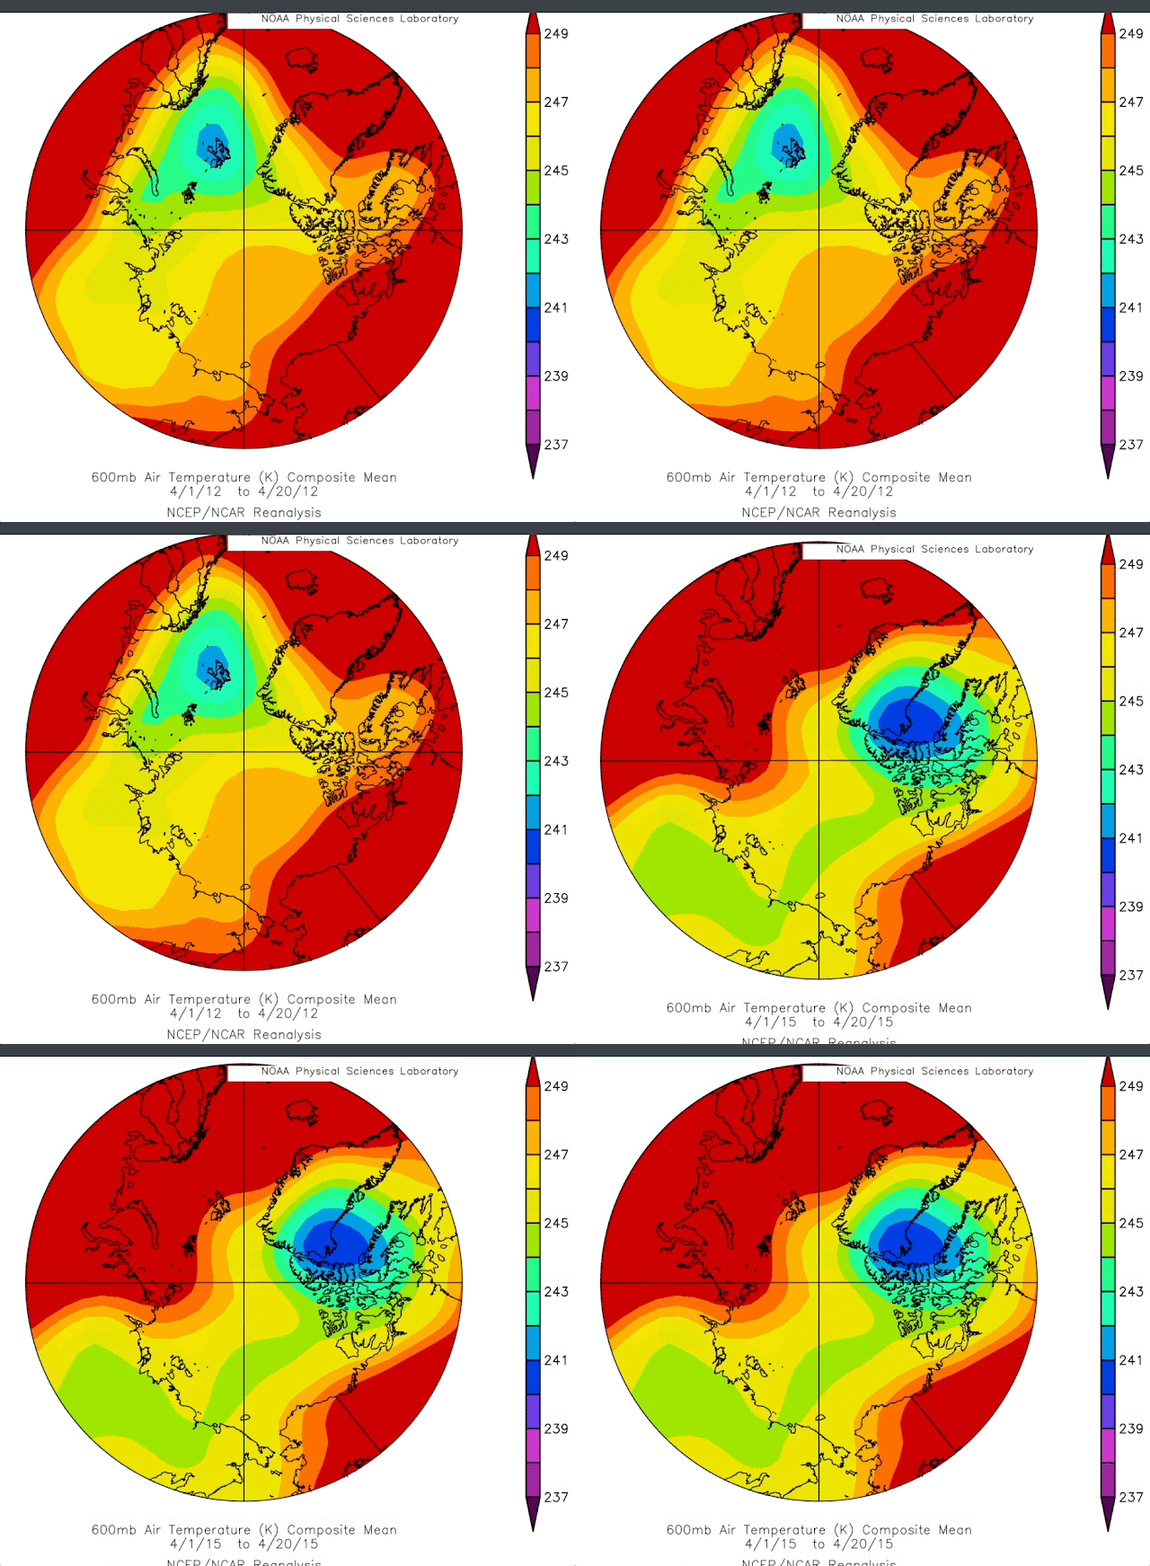
2012 Great sea ice melt retrospective, it was predictable in April

~A refraction magic rabbit (a new way of seeing things,  to be published in peer review paper), popped out of the hat in early spring 2012.  

~It turns out a very warm spring atmosphere made it possible

~Comparison of top 10 sea ice extent melt follows:


Before we do top 10 sea ice melts,  let's look at 2012 vs 1977.  2011 sea ice situation was grim,  1976 was opposite, much more multiyear sea ice was covering the entire Arctic Ocean.  This made it easy for the Polar Vortex to be North Pole centric then.  Notice the green zone -30 C temperature area at 600 mb height (those favoring 500 mb can be greatly confused by stratospheric influences).    2012 was exceptionally warm for the Canadian High Arctic (so did say the rabbit).  

                        Likely #11,  2021
What happened in 2021?     After all 2020 was 2nd place in sea ice extent.  The vortex regained the Pole,
this guarantied a great influx of clouds from the North Pacific sea surface temperature '"hot" blob,  in addition to accelerating importation of moisture by equally super warm North Atlantic, summer Arctic clouds save ice from melting completely hence the appearance of a cold air recovery.

8th Place, 2008 the LaNina Spring super sunshine melt ponds


   2008 vs 2012  LaNina was raging in 08 giving a reduction of clouds ,  causing more insulation, but starting from a much colder spring atmosphere. 

   In 7th position:
Spring 2011 was almost bipolar for the Polar vortex, the Canadian Archipelago very strong vortice of the Polar Vortex assured 2 things,  dry air from North Greenland towards the Pole and the wet North Pacific moisture trust directly towards the North Atlantic,  in imagery words,  apt for good solar input for the Arctic Ocean,  
#6  2015 the warmest year in history then
The waning -30 C green zone plus the Baffin Bay centric center of the Polar Vortex,  similar to 2011,  assured 2015 prominence in melting.
#5   The sun melt year: 2007
2007 600 mb  spring temperature was practically similar to 2012 the area having the greatest melting by sunshine was North of Alaska Beaufort sea  we can see clearly a favorable North Siberian in provenance circulation of dry air. 
  #4  super ENSO warming; 2016 
2016  green -30 zone shrank to near 2012 dimensions along with a stifling encroachment of red (-24 C) areas all throughout the Arctic ,  again favoring dry air from Siberia sun warming.


3rd sea ice melt place; The great small but very cold CAA Vortex 

2019 may seem much colder than 2012,  however North Atlantic and Pacific had a very warm spring atmosphere.  Again key,  dragging dry Siberian air over Alaska and Eastwards,   The Canadian Arctic Archipelago vortice was measured stubbornly in place for the longest time assuring these dry (less cloudy ) air conditions. 

2nd only to 2012:  2020
The second most powerful sea ice extent melt had no blue zone (-33 C) similar to 2016,  we can also note the heat strangling cold areas red zone, particularly South Greenland Baffin Bay,  but in particular the position of the polar vortex center,  North Pole centric,  not because there was thicker sea ice there , but because it was coldest there.    A stable warm area encourages a stable cold center which was the Pole. Also noteworthy; North Alaska air being warm after the long dark season seems to assure a forthcoming great melt

    All in all we can now project with a greater deal of precision whether the sea ice minima will be small by mid-April,  another prediction tool thanks to said "rabbit" refraction trick which suggested looking at these holistic temperatures.  WD October 30 2021

Tuesday, October 26, 2021

Cloudy days heat transfers, 3d sea ice transforms, a different perspective about 2021 summer sea ice melt

   October 6 2021 arrival of Arctic Ocean multi-year pack   completely flattened,  thin,   not changing sea water temperature a great deal,  not stimulating new ice to form.  Of which sea water temperatures were abnormally warm,  despite said presence of pack ice. Open water above 0 C temperatures of end of September rivaled 2012 same date measurements.  

~It is important to consider sea ice extent in all its dimensions.  Not just compare the horizontal one.

~Whereas a penetrating 2007 or 2012 sunlight melt didn't occur,  there was a great loss of ice nevertheless

~The proof is in the size of multi year pack ice,  usually seen floating away from the Arctic Basin looking like a mix of first year and much older ice with various height profiles,  giving the impression of a spectacular jungle of sea ice vertical shapes, 2021 had no such great old tall forms to observe.  

  Surface temperatures October 2021 are the warmest the Canadian archipelago had in history,  despite 11th place finish of Arctic sea ice extent at minima.  The disconnect between the two suggests a much warmer sea,  spreading around heat more evenly,  even under a huge area of intense cloud cover lasting months, with very little insolation to speak of. 


2021 October 26 (left) and 25 frost and drizzle accretion,  South Cornwallis Island (-1 C weather).    With end of October 16 C above normal,  almost everyday was at record or is a record maximum temperature for the entire month!


      October 6 sea ice arrival,  speaks for self,  especially for those who are use to seeing fall ice movements. WD October 26, 2021