Thursday, November 30, 2023

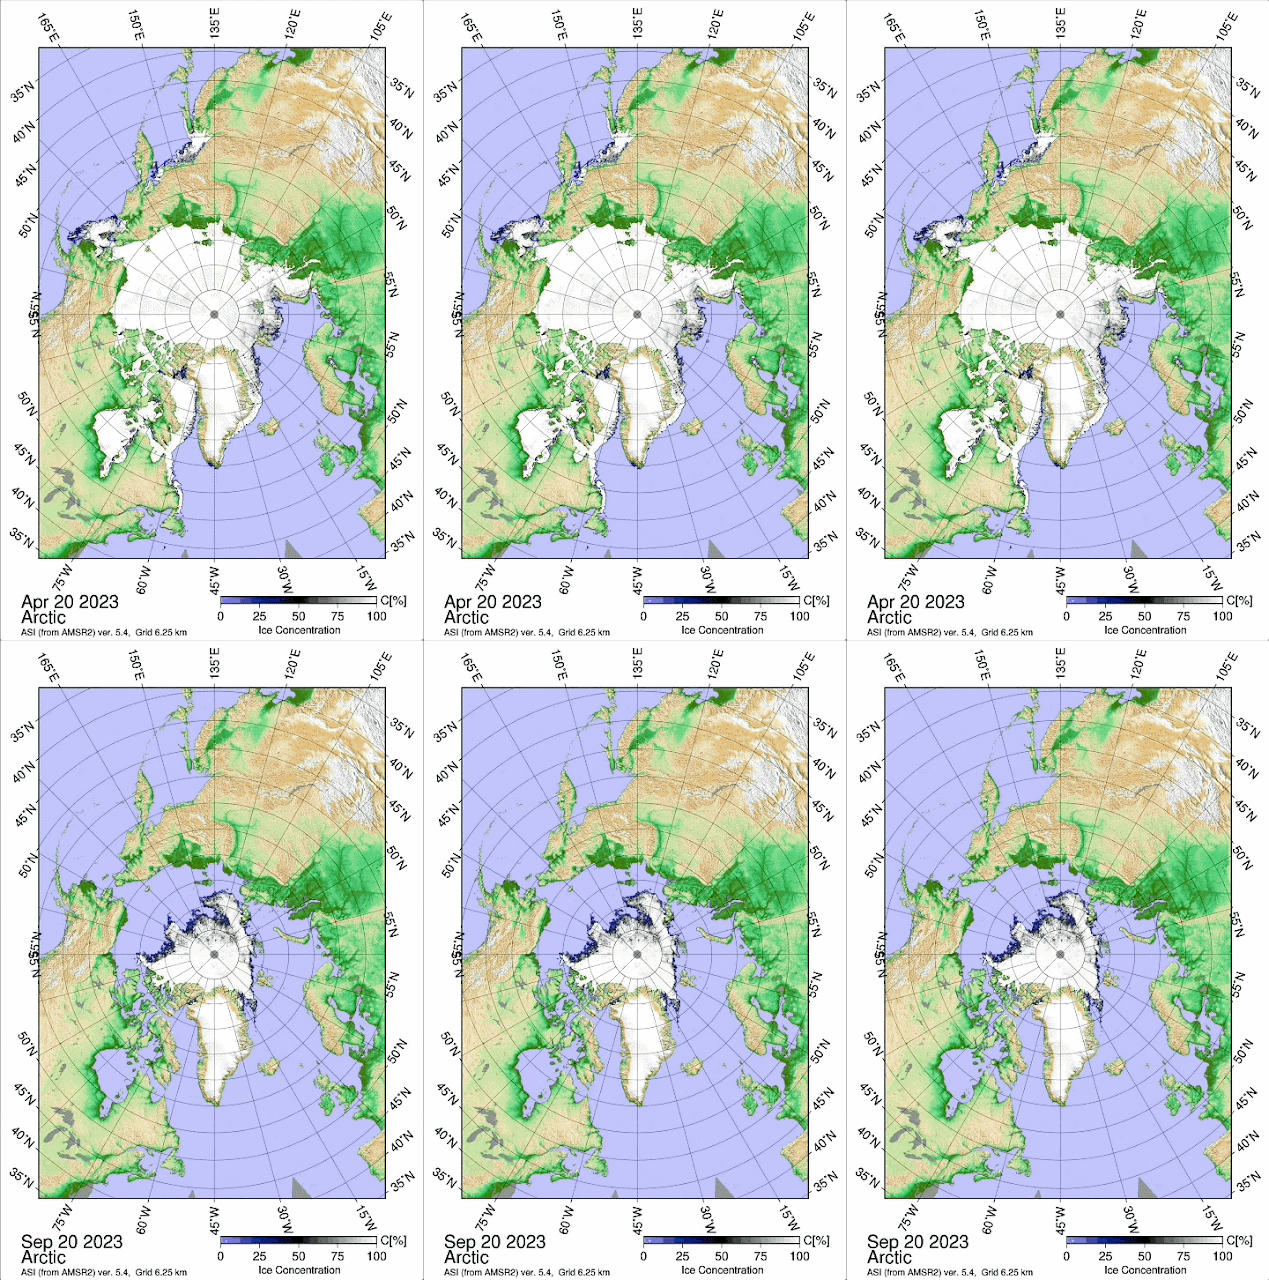
Warming a bit masked by sea ice extent minima numbers. Summer clouds from Global Warming excess moisture is saving Arctic sea ice from completely melting every year.

 ~EH2r April sea ice projection morphology was bang on

~Extent numericals slightly off,  again by underestimating  cloud effects.

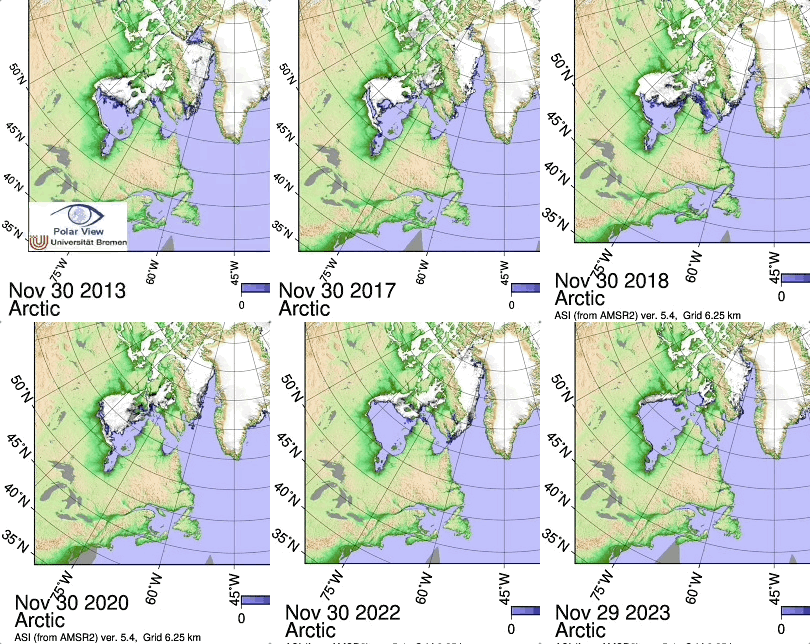
~Hudson Bay early December sea ice in dire straits.  

    April 2023 sea ice minima extent projection:

Was very good.   


     Estimating sea ice morphology forecast breakthrough.  How does one see it coming to be when there was so much ice cover in April?  By finding out where the CTNP was located  all winter.  Cold Temperature North Pole winter 2022 2023  was peculiar.  But severely studying its gyrations gave this remarkable success.  However extent numbers were off by not so much,  sea ice extent forecasting is much more easier to do than a few years prior though. The problem was the obsession with 2012 and  2007 minima's,  which likely had more sunshine than all the other years, caused by combination of ENSO strengths and CTNP locations.  Which is still the case,  ENSO variant is particularly important.   The more clouds covers Arctic summer the less sea ice melts.  In particular 2007 had a great low albedo period,   2012 was a bit more complex,  with a particularly warm Arctic spring,  a CTNP geographical effect.    Since then sea ice thickness shrank, gradually,  with apparent moderation from greater cloud cover,   mainly from the great North Pacific warm sea surface blob.  

   Indeed,  Arctic sea ice can vanish almost completely given an extensive period  of low cloud cover,   The only way this can be done,  would be by massive summer La- Nina,   recent ones  has had a hard time exceeding the moisture coming from the warm Pacific blob.   It is a reprieve of sorts from yearly rapid sea ice extinction,  however the gradual melt down continues unabated,  heat from the surrounding massive oceans will eventually warm the Arctic Atmosphere causing less clouds.  And cause what is already happening in some key areas,  Hudson Bay being one of them:


Hudson Bay sea ice is more vulnerable because it is surrounded by land.  which dries out some of the North Pacific and Atlantic moisture giving clouds.  Now its virtually ice free when it should not be,  likely from prolonged summer insolation warming . WD November 30,  2023

Thursday, July 13, 2023

This July STEADY to STOP weather was foreseen in April

 ~Remarkable prediction success,  the new world weather order is here to stay.

   OK ,  back in April  ,    July projection:


July 13, 2023:

    "Historic heat streak"  was twinned with historic flooding particularly in Vermont USA.  EH2r April projection was written:  

                                  "With steady stagnating weather over North America, where its hot will persist hot,  where its moist will be soggier longer."


     The larger picture is clear, July 13 CMC loop shows no apparent or slow circulation:  

In fact it can be argued that the circulation has stopped in some parts :

Look at the mouse cursor pointing at Hudson Bay Low over one day,  literally not moving,  amongst other weather features,  but of course around any cyclone there is movement.  But when the cyclone stops moving,  the larger  general circulation is stagnant with respect to weather systems,  this gives troubling weather at any time of the year...  

     And so,  Global Anthropogenic enhanced Warming,  gives this kind of summer weather.  Being able to predict this feature,  was largely because the subject was observed many times,  the mechanics was finally uncovered in large part because climate scientists accepted GAeW as a fact,  they have taught this subject as best they could,  and to prove this good understanding, the projection or forecast,  from a humble student,  had to come through .   Anyone who does not dwell in this respected field,  who makes stupid claims that GAeW is not happening has naturally failed to predict anything correctly ad nauseam, should be shunned.  WD July 13, 2023


Thursday, May 25, 2023

EQUILIBRIUM , new horizon refraction discovery of what happens when Ti***=Tl***

 ~When heat radiation balance of Arctic lands  equals Sea ice ,  something extraordinary happens.  

~The Northern Hemisphere general circulation radically changes.  

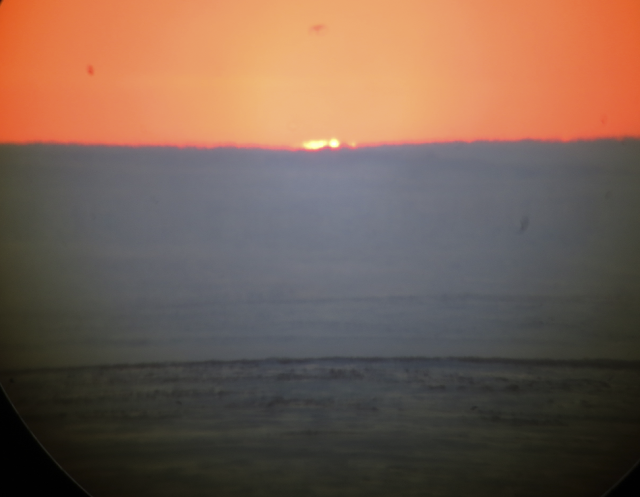
    Whilst doing optical refraction research,  I discovered a thermal balance horizon image,   horizontal refraction between land covered by snow Tl***,  was the same as horizontal refraction of sea ice covered by snow Ti***,  on May17-18 this happened.  I realized that this was an important moment,  when the radiation balance of the entire Arctic became in equilibrium.  Thus,  there was no longer competing zones with the coldest air in the Arctic,  the Cold Temperature North Pole,  CTNP.  But rather a Pole centric CTNP.  Instead of 2 CTNP's on each continent there became only one.

                                                                                                       From May 7 to 17 the 600 mb coldest temperatures fractured the world with planetary waves  right above,
the 2 CTNP's looked very much like Galaxy simulations about to merge.  But the weather further South was perturbed by these waves,  hence General Circulation flowed or surfed the waves.    Which meant that in some zones ,  the weather appeared quite stable.   All this changed on the 17th,  where upon it is likely that the entire Arctic energy balance was more steady,  no more was land surface colder than sea ice .  Being equal means a consolidation of weather patterns.  The North Pole is coldest now,  because that is where the least sun radiation reaches the surface,  the Arctic continents have warmed to the point where they have lost the ability to generate deep cooling.


May 18 onwards , left,  600 mb represents the Density Weighted Temperature of the entire troposphere,  at least it is the closest standard level to it.  Here we see the North Pole centric nature of a single CTNP.  This brings about a much more fluid weather circulation pattern Southwards,  with planetary waves far less spread out,  otherwise if longer causing such weather phenomena as "Omega Blocks"  .  This less mega wavy geometry has coincided with the land and sea ice horizon refraction being equal,  for many days since the 17th . Near North Pole weather is far steadier as well,  with frequent Quasi Stationary pressure systems,  again appearing within a day when optical refraction on land became undistinguishable with sea ice. This Arctic equilibrated surface thermal feature completely has changed weather Northern World wide.   


     CMC surface analysis May 20 at 06 12 18 and may 21 00 UTC .  Look at the QS ,  Quasi Stationary Cyclone at the North Pole,  WD May 25 2023

Saturday, April 29, 2023

2023 spring summer fall major weather patterns projection by unorthodox means, map projections

 ~Not quite 2022  more like 2007 spring and 2012 August

C is Cold Temperature North Pole,  in green is the jet stream,  dominant locations of cyclones and anticyclones are placed,  the latter means more often than not you will see a High or a Low on the coming weather maps.  

    May to June 21,  2 CTNP zones,  the Ellesmere Island one stronger of late,  but the real cold  imprint was from Northeastern Siberian CTNP's dominating during  much of the winter.  The Arctic Basin Gyre switchover will occur late,  at around the solstice,  which means a great potential strong melt North of Beaufort sea but this will be slowed by Cyclonic clouds.    Rainy on the Northwest North American coast,   but somewhat not diluvial since the great SST North Pacific warm blob is smaller than recent previous years.  Northern Europe would have the benefit of clouds as opposed to the Mediterranean shores baking.   
     June 21 till mid September, sea ice direct sun melt reprieve with the Low pressure mainly hanging on top of the Arctic Ocean Gyre, along with North Pacific in provenance moisture,  giving clouds,  mitigating an otherwise disastrous start of the melt season.  With steady stagnating weather over North America, where its hot will persist hot,  where its moist will be soggier longer.   It will be stubbornly cloudy for most of North of Russia Arctic ocean shores  throughout the sea ice melt season.    However disastrously hot over most of Siberia at some distance from the Arctic Ocean.   Likewise extreme heat in Europe and North Africa.  Not to be as bad  in North America,  because of the sea surface high temperature blob of the North Pacific injecting moisture eventually mixing with Gulf of Mexico evaporation for the East coast, proximity to El-Nino will add up favoring more clouds as well. Even with very slow to not moving systems,  multiple heat waves will abound.  Along with a very  slow moving hurricanes and typhoons most having great strength ,  fortunately not as frequently landing to shore,  with hurricanes and typhoons mainly wandering aimlessly over very warmed up ocean sectors,  but those who do reach land will  not be pleasant,  with not much  returning to normal after passage.  

The ultimate test of understanding our present climate,  sea ice projections.   

        Ever so difficult to be exact,  more so than any climate projection attempts,  is the sea ice extent at minima ,  usually  mid-September,  here is a look at last years projection adjoined with 2022 actual JAXA extent on September 15: 
2022 projection failed in morphology on the Russian Quadrant from the North Pole ,  not so much in over all extent.  I am more confident about this years shape of sea ice minima perimeter to come:

The 2023 minima should have finally less sea ice than 2012,  despite the clouds
from El-Nino and the North Pacific blob, primarily because there will be a 2012 cyclonic repeats in August, and since the over all sea ice is thinner than ever.    The NW Archipelago shores should appear more open at times because of the effects from these Arctic Ocean  Gyre hovering cyclones,  despite sea ice tendency of piling up or ridging on the archipelago coast  by the tides.  WD April 29. 2023

Friday, April 28, 2023

2023 spring summer fall major weather patterns projection by unorthodox means

~Unusual winter CTNP pattern has created a ripe sea ice-scape for a 2007 melt scenario.

~The North Pacific high sea temperature anomaly has been tamed, sort of,  mainly on North West American continent coast

~Stable temperatures will start early for most of the US and Canada

~While rains will be confined again to extreme NW Europe


Sea ice First Melt, a sign of 2016 like melting 


2 major factors have permeated vast swats of sea ice, one is a lesser snow cover, the other except for a brief period, was a milder High Arctic winter. It is complicated, less snow cover means thicker sea ice accretion, but this was largely tempered by the milder winter in total darkness.  This makes the cold sea ice core not susceptible to cause significant horizon refraction, but until warmer spring temperatures happened.    Therefore, we have a first year ice likely encouraging a more rapid melt, snow conduction cools the melting process a lot, bereft of strong snow albedo,  new year sea ice will vanish quicker.


    First sea ice bottom melt can be detected when the astronomical horizon height is equal to the sea ice horizon, it basically tells the melting rate for later in spring and summer.  


   Last 9 years comparison results includes 2023 next to 2016,  a great sea ice melt year.   There is great potential for the new sea ice to vanish quickly,  given future sunny conditions,   which is determined by additional means,  so it goes like this:


2018-2015-2022-2023-2016-2020-2019-2013-2017-2021


   2021 had a lot of snow on top of sea ice, it is a great factor in saving it from melting fast.    2023 had mainly new sea ice in the observation field, melt pond indicator should be weak given none abundant snow cover not only here but everywhere.  


Vertical sun disk diameters, what is the score?


Maximum decimal expanded vertical sun disks per year: 


2018 2019 2020 2003 2022 2002 2023 2004 2007 2008 2014 2011

  0           0           0           1            1            2              2             4            4            4           4          5

2017 2012 2021 2009 2010 2013 2005 2006 2015 2016

  5            6          6           8            8           8              9           10           13           19


      2023 was done with 550 sun disk measurements,  from 119 elevation decimal levels,  with observation period from late February to end of April.   2023 results are in the same modern era of the recent great Cold Temperature North Pole displacement, largely hovering to the Northwards, highly concentrated in the North Baffin to Ellesmere Island area of late.  The greatest cooling was determined by refraction measurements especially above 5 degrees altitude, which matches to where Green House gas induced cooling should exist, upwards from the mid layer of the atmosphere, this data is very compelling,  as the surface warms,  the near horizon sun disks expand along with sunsets shifting Northwards,  while the upper mid layer and above cools, compressed sun disks happen,  with literally multiple thousands disk measurements confirming this.   2016 was the last year when colder air was less centralized within the Polar Vortex, up to that year the High Arctic atmosphere cold air was more geographically spread out and homogenized.   Since after 2016 the Polar Vortex shrank in geography, became highly stable over the said smaller portion of the High Arctic.  Sun disk measurements have lost the ability to predict Global temperatures since that year as well.   But knowing this gives a better idea of how long the CTNP would subsist into spring.  2018 to 2020 had a very strong frozen area over the Canadian High Arctic. This withered a bit in 2021, only to continue in strength in 2022 and 2023.   Its best looking at sun disks between the years 2018-2023, 2023 had the second warmest CTNP at the coldest core of the Polar Vortex, a sign,  the stable extreme but smaller cold zone is warming year by year.   


Massive Sunset Field shift


       EH2r sunset monitoring had the largest field shift in sunset tardiness,  whereas the West,  the traditional tardiness quadrant,  became tame,  and the Northwest  had very late sunsets for the first time ever.  One at 92.54 Zenith angle and some 7 degrees Northwards compared to previous records going back to 2001,  there were others up to 3 degrees azimuth Northwards,  huge numbers,   in the past they were very predictable and tame compared to the Western field.  This basically  infers a very rapid warming of the ground and sea ice,  due to lack of  snow and no deeply entrenched in the ground or ice winter cooling during the long night.  


Fata Morgana of Cape Sheridan hill, never seen before in 37 years.  23 of which were intensely observed.   


     Part of April 7 sunset , 2.54 degrees below the horizon, 7.5  degrees to the Northwards from multiple past steady observations,  equivalent of 15 sun disks place one next to the other.   Both sun and sea ice horizon line were highly raised by strong  inversion,  this was never recorded or seen since 2001,  the ground surface appears darker,  with rock ridges mixed with patchy snow coverage.  


     This is particularly what Climate Change literally looks like,  the optical effects of Global Warming in a place far away from any industry or urban development,  as far away as you can imagine, this Arctic land is becoming and looking like a different world........   Map projections in the next article.  WD April 28, 2023


Wednesday, April 5, 2023
April 5 2023 sunset, rapid surface air cooling by sea ice and permafrost.

 ~It likely was a mix,  warmed up thinner sea ice with little snow cover rapidly cooled surface air,  but also on land (the appearing red flash), not having so much snow as well, warmed during a sunny day with light winds,  with permafrost boosted cooling of interface air at sunset.  


    Must invert the GIF's for proper perspective. It has been a strange sunset season,  mainly influenced by the least snow cover in many years.  Top permafrost was vulnerable for a great cooling,  however winter past was mainly warmer than usual,  with only a few weeks of deep freezing hovering about  -40 C.  As a result we have had no very rapid rebound cooling on the surfaces,   until air temperatures got warmer while permafrost and sea ice steady peak cold temperature layers became prominent compared to air temps,  exacerbating stronger thermal inversions....    In other words,  it is starting to be interesting late in the season,  while it was very dull earlier.   Notice the multi colour flashes, this was routine throughout  winter when the sun was up,  now we have to wait for temperature contrasts to form. WD  April 5 2023


Astro dating Ancient Egyptian RA coronation ceremonies, the guide.

 ~The research results leading up to this guide is kept for peer reviewing.

~The technique is simple and relies on the Great Pyramid establishing a standard precedent following centuries  of  a secret Pharaoh  accession to the throne practices, which continued thereafter construction completion until the fall of the Pyramid age.   

                There is still a modern day  Khoiak,  a Coptic holiday starting in December of our calendar.................  Long ago etymology likely derived from  Khufu Ahket,   the name of the Great Pyramid.  In the architecture of the this pyramid we can find at least 2 yearly solar calendar dates.   Being solar requires that these structures need be dedicated mostly Southwards.  

         The first incorporated date marker can still be in effect yearly in our modern times, it is in the Kings chamber, Southwards 45 degree shaft.  In meticulous stone work is once again Ancient Egyptian obsession with the angle of 45 degrees.  Many astronomers and Egyptologists,  probably most of them, even the fringe theorists,  have written this 45 degrees being related to Orion constellation belt stars, mainly circa 2570 BC.  But this obsession predates 2570 BC by several 100 years.   The autumnal sun transit angle at 45 degrees was prime,   occurring once a year,  signaling the start of the  growing season, matched in religion at the same day as Osiris rebirth.   Prominently written in the first the Palermo stone hieroglyphs, we find 1st dynasty Pharaoh estimated to be Djer or Djet having ascension to the throne Month 4 day 13,  this should be November 1 (Gregorian, our calendar),  considering the first day of the year is the heliacal rise of Sirius from 70 day absence, usually appearing on July 19.  In the Great Pyramid King chamber South shaft,  45 degrees angle, shone the sun initiating the start of Hb Sb festival.  It was so before this shaft was planned to be assembled, well before October 31 2370 BC,  the likely date of Khufu's ascension and the start of the Great Pyramid construction.    

   2 very important events,  Osiris rebirth and start of seeding period was perfectly set day by the sun itself.  It was officially meant to repeat itself every year and theoretically the sun should still shine in this shaft,  despite no more Nile floods.     

      The second incorporated Pyramid date was fixed in stone but represents the era of 4th Dynasty Pharaohs. Carved in this one slope is a solar and Sirius co-joined date,  November 20 2370 BC  , "Ka-her-Ka",   joining of the souls ceremony, a secret coronation ritual occurring when the transit of the Sun during the day is at the same level as the transit of Sirius during the night.   This was a unique day,  later related to the Queens Chamber South shaft angle of 39.6 degrees.   In 2340 BC this ceremony was very likely  held,  but this time in the Queens chamber,  the 30th year jubilee of Khufu.   This is how the Great Pyramid can be dated.  A method not only for pyramids,  but valid for all other Pharaohs following the Solar/Sirius  RA/Sopdet (Isis)  perfect calendar who hopefully left a structure aimed at the sun and Sirius,  a likewise engraving or strange writings with lines having angles a few degrees off from 40 degrees.   39.6 degrees set a precedent, it was unique for the Great Pyramid, the Cathedral of Ancient Egyptians who practiced the Solar religion ruled by RA.   Post 4th dynasty, you need to find the Great Pyramid shaft angle of 39.6 etched somewhere and another higher slope angle feature in order  to identify the cult practice. 

    The Great pyramids still offer complexities to be deciphered,  but simplicity itself was hidden in front of everyone for generations.   However, I am not sure if religious practices included dissemination knowledge about construction slopes to the contemporaneous populace, for certain this secret knowledge  was surely entrenched and relearned by the solar RA priesthood for as long as it survived.    The first of November was an important yearly event, the 45 degrees sun at noon,  did not guarantee perfection with respect to the start of the seeding season,   it was an angle with more religious and Pharaonic establishment connotations than with farming,  moreover the Orion star belt has a level of meaning several magnitudes lower than a tangible relivable perfectly synchronized sun calendar day. 

Recap:


     All known shafts except one seem to have a clear practical simple purpose.  The King Chamber South 45 degree shaft  can still be in use every year.   The Queens chamber South shaft was not meant to be permanent,  thus found sealed at both ends,  it was part of a secret "joining of the souls" ceremony of the Pharaohs mainly for the 4th dynasty.  especially dedicated for Khufu,  the renewed "Pharaoh 0", enshrined forever.   WD April 5 2023  


1     

Wednesday, March 15, 2023

An accurate historical timeline, vital for climate studies. New Archeoastronomy discoveries. Akhenaten Boundary Stelae linked with the Great Pyramid architecture might help perfect our Ancient Chronology,


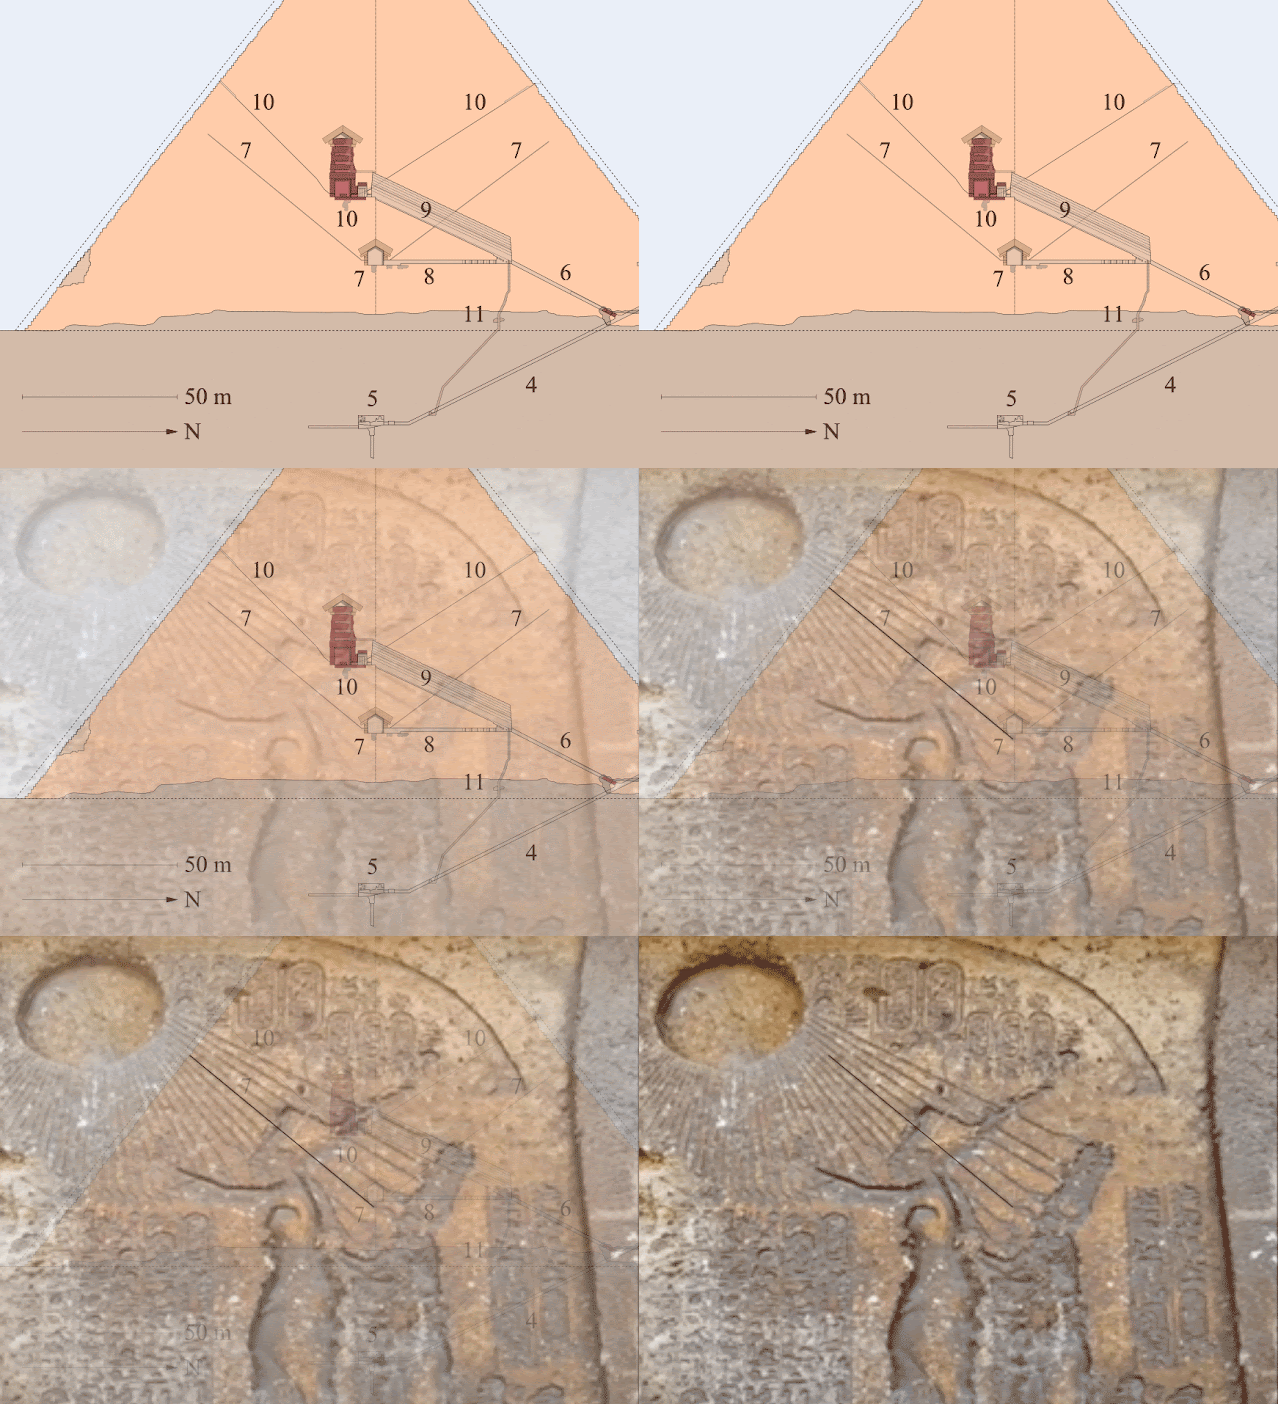
 On this well leveled photo,   we see boundary stela B,  at tell el-Amarna, ancient Akhetaten , juxtaposed with the Great Pyramid. There is a perfect alignment by way of a single sun ray going down the great pyramid Queens chamber South shaft,  having the same angle as with the ray touching Akhenaten's crown symbol called the Uraeus.  


This seemingly impossible coincidence, between badly damaged Boundary Stela B single sun ray alignment is simply astounding. There was no software manipulation at all achieving this image, the Queen Chamber South shaft and Uraeus sun ray simply matched straight from the internet.

There is a very low probability for this alignment to ever happen by chance. However, there is an astronomical reason for this link. It was from an Ancient Egyptian coronation ritual practiced 1000 years apart. These coronations can help calculate a solid date, given that we have another sun angle for Akhenaten’s ascension day, tentatively crowned November 22 1313 BC. 39 years earlier than the official chronology.

Certain sun and Sirius positions in the sky inspired the very architecture of the Great Pyramid. It also provided by chance a general but much more focused construction period for the Great Pyramid as well.

The very altitude point in the sky when Sirius and the sun existed at the same level was the day when the RA coronations took place, this was the very reason for the South shaft angle found in the Great Pyramid Queens chamber. As Akhenatens Uraeus sun line strongly implies.

I’ve calculated, with the help and suggestions from a good friend, the construction start year for the Great Pyramid, 2370 BC, a year almost exactly in between the standard Chronology 2570 BC and the GP carbon dating multiple sample results of 4150 BP. The Great Pyramid was built in the age of Aries having a vernal equinox sunrise. This calculation is a very close approximation with a little margin of error.

To inspire further research, I have written two essays, one for each era, which need publication in an interested science journal. I can’t publish in a peer review journal at present because of resources not easily accessible in the Arctic. I am currently trying to find a partner co-author, it is a difficult almost impossible process given my isolation. Failing to find a journal willing to publish, these essays will be eventually read here, unfortunately not the greatest readership impact. Unable to have leveled higher resolution pictures, precludes acceptance to a journal. Because they can be made or exist and publishers like the best quality photos. High quality images also reduce the probability of error to a minimum. A small solace to ease the coming formidable doubts in the well established ancient chronology authority which will provide extremely stiff resistance, most likely ridicule, to stop any changes from happening at all.

Example of what an extensive warming period can do

The Pyramid civilization collapse has happened 200 years or so after the construction of the Great Pyramid. A lot of what was gained in technological advancements, much improved from or coming from the great man of science Imhotep, was lost.  A massive intermediate period of famine with enormous chaos and destruction was the cause.  Undocumented wars surely happened, enemies, without or within the climate affected countries always attacked their foes at their weakest moments.

The Great Pyramid was an awesome accomplishment. It also offers the best example in human history for showing the ravages from Global Warming as opposed to what can be accomplished when we do not waste resources on repairing climate driven disasters . Ancient Egypt went from eventually experimenting with pyramids having large stones, to accomplishing a few huge ones at Giza, seemingly perfect, then not long after,  totally forgetting the techniques achieving them.  The subsequent greatest structures were of mud brick,  carved on or inside hills  or with recycled stones from looting previous constructions.   


      The world today would be very different was it not for a small but significant climate warming periods devastating North Africa.   What will happen to us with the ongoing super big global warming might be quite similar, despite our vastly improved technologies in some domains.

Current Ancient Chronology vs Greenland ice cores

In general if there is a colder Arctic, moisture from the Atlantic Ocean tends to flow West to East at a more Southward latitude towards the equator, providing greater cloud cover and of course heavier precipitation to Southern Europe and North Africa. Absent the cold winter atmosphere, moisture rich Atlantic ocean air tends to travel to Northern Europe, leaving North Africa much dryer.

As a good example, at the moment, North Africa has some moisture driven by present colder winter

MIMIC-TPW  ver.2   March 13 to 17 2023,  Total Precipitable water,  we see the source of water for the Nile from the East,  and also in particular the cloud source for Northern Egypt,  from the West.  This is what a cold Arctic atmosphere does to North Africa.  

 Greenland ice core temperature reconstruction.

During ancient history, there were great droughts, one in particular , namely during the famous first intermediate period, according to present chronology it was 2183 to 2060 BC. Officially on this GISP2 graph, it was a cooling period.

Another one, here we see 2570 BC in the middle of a significant warming trend, not necessarily a drought driven period (I have not read about a drought during the first 3 Ancient Egyptian dynasties) but it was not a wet period. Gisp2 graph 2370 BC had a more stable temperature period, likely when a lot of resources were not spent on survival,  but rather on some construction projects. There are other examples of interest to pick at. But lacking a high precision chronology history, makes ice core analysis somewhat tenuous.


Ancient Chronology in yellow,  does not make any climate sense,  Prior to about 1000 BC,  devastating droughts of the 1st and 2nd intermediate periods occurred during prolonged cooling trends.  The archeo astronomically calculated  corrected timeline (in green),  shifting the Great Pyramids 200 years earlier,   appears far more apt.    Alexander the Great timeline is not modified, the chronology seems more precise going forward in time from that point, but what we see here is a pattern.  War or civil wars comes about a lot during the warming periods.  The said Zenith era of Ancient Egypt ,  from 18th Dynasty pharaoh Hatshepsut onwards was during a cooling period following a  2nd massive intermediate warming era which ended in  wars.    

In these warming days with extreme and well documented climate and weather disasters, it is imperative to understand the historical repercussions of a warming world more than ever. WD March 15-16 2023


Age of Great Pyramid.    Great Pyramid  .   Ancient Chronology correction  .  Ancient Chronology is wrong  . How old is the Great Pyramid?  .  Corrected Ancient chronology  .  Proving age of Great Pyramid  .  Queen Chamber  .  King Chamber .  Why are the shafts sealed?   Orion belt  .  Cosmic journey through shafts  .  Hieroglyph in Great Pyramid  .   Giza  .  Giza plateau .  Great Pyramid of Giza .  Sirius alignment .  Sirius theory .    Atlantis is Egypt  .   End of civilization .   Civilization collapse . Great famines .      Who built the Great Pyramid of Giza and why?  Pyramids of Giza . Great Pyramid of Giza  . Latest discovery Great Pyramid of Giza  .  Great Pyramid of Giza facts .  How long did it take to build great Pyramid of Giza  .  When was the Great Pyramid of Giza built?   Pyramids of Giza . 

Sunday, March 12, 2023

Kennedy Channel the new super highway of broken sea ice, absent Nares Strait long existing circular frozen floe edge let alone a very important ecological ice bridge

~Nares Strait circular floe edge stemming from solid steady sea ice use to form earlier than November,  can't see it now during the coldest of winter

~A very ancient once, very important for wildlife and people,  steady ice bridge does not seem to form as well 

 December 1988 ,  the very noticeable circular floe edge between Northeast Ellesmere and Northwest 'Greenland in Nares Strait,  Kennedy Channel is Southwards the flow of sea water goes towards Kane Basin:

                    1988 December 8,          notice the ice bridge just here -------^^^^,  it was the traditional crossing  point for Inuit spanning centuries.  Who did cross the last time from memory in the 90's.  Was nice to have visitors from Qaanaaq Greenland cross over,  and even an adventurous Canadian from Ellesmere for a visit to Greenland.  A wildlife critical crossing point.  If it exists now a days....  its been so long since I have seen it,  I almost forgot it,  I doubt it does exist,  but if it forms,  it lasts a far shorter time span than prior to 25 years ago. 
  
 In 1850, famous in the Arctic Qitdlarssuaq ,  Qillajuaq,  the Inuk shaman  from North Baffin Island,    mainly the Pond Inlet area,  crossed the ice bridge,  not once but at least twice. with many followers, Canadian Inuit re-introduced the kayak along with other top notch Inuit  technologies to local Greenlandic Inuit.  The trek was legendary,  
    [same photo zoomed]   Back to the ring of circular floe edges,   it was essentially caused by the 
flow of sea water, broken by tides and current.  The ice surrounding it was similar to fast ice,  not moving,  and thick, a large ice shelf spanning from Ellesmere to Greenland,  totally blocking pack ice from the Arctic Basin to escape South. 


  Now look at this:

    Polarview January 17 to March 6 2023, at coldest winter minimum temperatures,  as if the circular ringed floe edge never existed.  


February 28 to March 4 2023,  sea ice is hemorrhaging Southwards,  the  once circular floe edge merely demonstrated how thick and consolidated sea ice was,   It's in transition towards extinction,  causing
reverberations throughout the Arctic. 

OK  further astounding proof:


              November 14 1988


November 07 1988
                                                               
July 22 1988 ,  Kane Basin fast ice bridge,.   Fast ice is frozen ice from open water attaching to land, from 1987-88 winter past,  surviving in July!

                July 17 1988,  no longer Nares Strait rings but an open floe edge surrounded by steady sea ice 

                                               July 11 1988,  Kane Basin fast ice ice is not pack ice yet.   

                                How much this world has changed!

 WD March 12-13 2023


Monday, January 2, 2023

Ultra precise long range temperature forecasts, Possible, likely only with 360 degree thermally balanced observation sites.

 ~The focus on improving Global Circulation  Models need be twinned with perfecting observation sites.  

 ~Near refraction observations have basically demonstrated wide variations in thermal profiles within 3 km radius from station center.  

~  These variations are caused by local,  natural  or not,  variable thermal topography easily causing wider surface  temperature variances,  making longer ranging  predictions almost impossible at unbalanced sites.

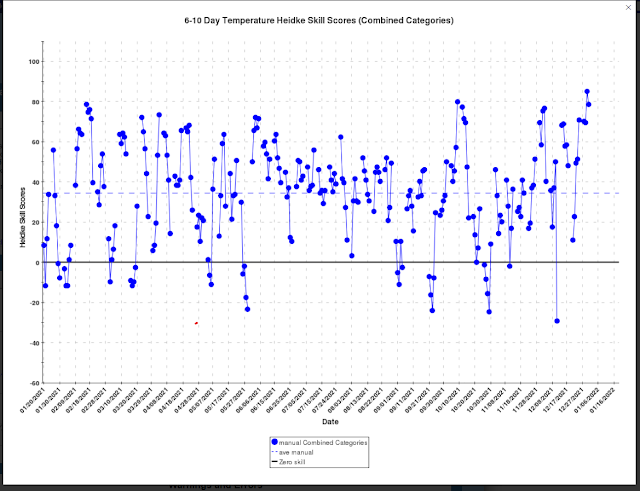
  Well known for failing often 6 to 10 day NOAA temperature forecast predictions,  no need to add longer range in a few months or so *Climate projections ,  they are worse.   It is likely not the models fault,  but rather the observation site measurements greatly prone for chaotic changes by very local effects.  

   Many years local near  refraction measurements never made much sense,  here in Southwestern Cornwallis Island Canada,  they rarely match optical refraction theory.  A demonstration can be made on request.  However finally,   after careful analysis ,  they match infrequently.   This is because Cornwallis Island Nunavut is surrounded by 4 different Straits,  having 4 different ice fields or depending on the season,  daily changing open water configurations.  The topography is also mixed,  from plateau 200 meter above sea level,  higher to where the observation site is,  46 meters ASL,  next to adjoining sea level  gravel beaches some 3 km away.  

    This means that locally funneled winds may carry greater influence by either of the said sea Straits ,  or these same winds may be curbed in mesoscale eddies,  not at all having identical thermal nature as direct winds coming from a larger circulation macro scale.    Therefore it turns out that optical near refraction data,  as explained by measured lapse rates,  or by any given day modeled temperature profile,  almost never match theory.  Or does so by an incredible,   about less than 10% of the time  (more precise data forthcoming).    In other words,  this observation Cornwallis site in question,  is very poor in representing the major temperature event of the moment.  

    I have no doubt,  thousands of observation sites used for models all over the world,  give identical results.  

    It is therefore not wise to use thermally imbalanced weather station sites,  for determining model accuracy,  but rather the focus should be on comparing model forecasts at sites which have no local thermal perturbations baked in their topography.  

    The best sites would be:  A buoy in the middle of the Atlantic, or a large lake, a station in the middle of a flat prairie without any major thermal altering sources,  something at a great distance away from a chaotic interfering geographical or fauna feature capable of changing the local  thermal weather pattern.  In the Arctic,  such sites are possible,  not common,  however there is always a lake, a river or a mountain about,  temperature variances may easily change a few hundred meters away.  

     Wherever possible,  identifying thermally balanced stations may help elucidate the real precision of weather models,  I expect them to be very good,  but trying to match temperature predictions with thermally unbalanced sites would be more ideal,  only after  determining the models precision capacity with observation locations as thermally balanced as possible.   I wont be surprised if the 6 to 10 day temperature forecasts are much more precise at such measuring points.  WD January 2,  2023