Monday, April 28, 2014

Sea ice thermal balance appears to be extremely sensitive to net solar radiation flux

~A small example simply reveals a big mystery.
~ For horizon observations,  sea ice must warm or cool faster than surface air,  this is impossible with a standard physics interpretation.
~There must be an unknown thermal transfer factor which has huge implications with sea ice models.

   Basic refraction optics are easy to understand.  A road mirage exists because there is very hot air above the pavement,  a mere few centimeters above,  where the temperature interface has a very steep unstable adiabatic profile immediately on top of the road.  The much hotter air creates an inferior mirage.   Similar inferior mirages are possible mainly during Arctic fall. A lesser  optical effect with a not so steep but strong adiabatic lapse rate are horizon shifts  which are called dips.  It was observed repeatedly that refraction horizons vary greatly over sea ice,  but these variations are linked with the surface to air interface just as much.  Like the hot pavement,   sea ice is a thermal body,  however much unlike road materials,  sea ice reflects more incoming sunlight without absorbing it.  But the following sequence suggests that sunlight,  even a fraction of it, was very significant,  in fact heated top of sea ice enough to lower the horizon dip significantly before the horizon rose again as with:

     Left to right April 20 2014 evening sequence of sea ice horizon rising within less than 1 hour.  The winds were light (10 knots or less),  the recorded surface temperatures fluctuated less than 0.5 degrees Centigrade.  Yet the sea horizon rose while the sun astronomical elevation dropped from 5.5  to 2.3 degrees.  The only thermal variance is with the sun basically weaker,  injecting less net rays.

     By theory,  sea ice has greater thermal capacity than air, it should not change in temperature at the same time rate as air does.  But this sequence suggests surface of sea ice cooled faster than the air right above.  A colder than air sea ice surface causes thermal inversions,  with horizontal layers readily seen in the left  and center photos.  Atmospheric inversions raise any object in the sky,  including the horizon.

    A same sequence during wide open water Arctic fall time will not repeat the same phenomena,  unless there is ice present.  The relation between not so varying sea surface temperature and the height of the horizon was made clear (paper almost done). There is a direct relation between sea surface and surface air temperature.  The steadier sea surface temperatures revealed a robust repeatable temperature proportionality.

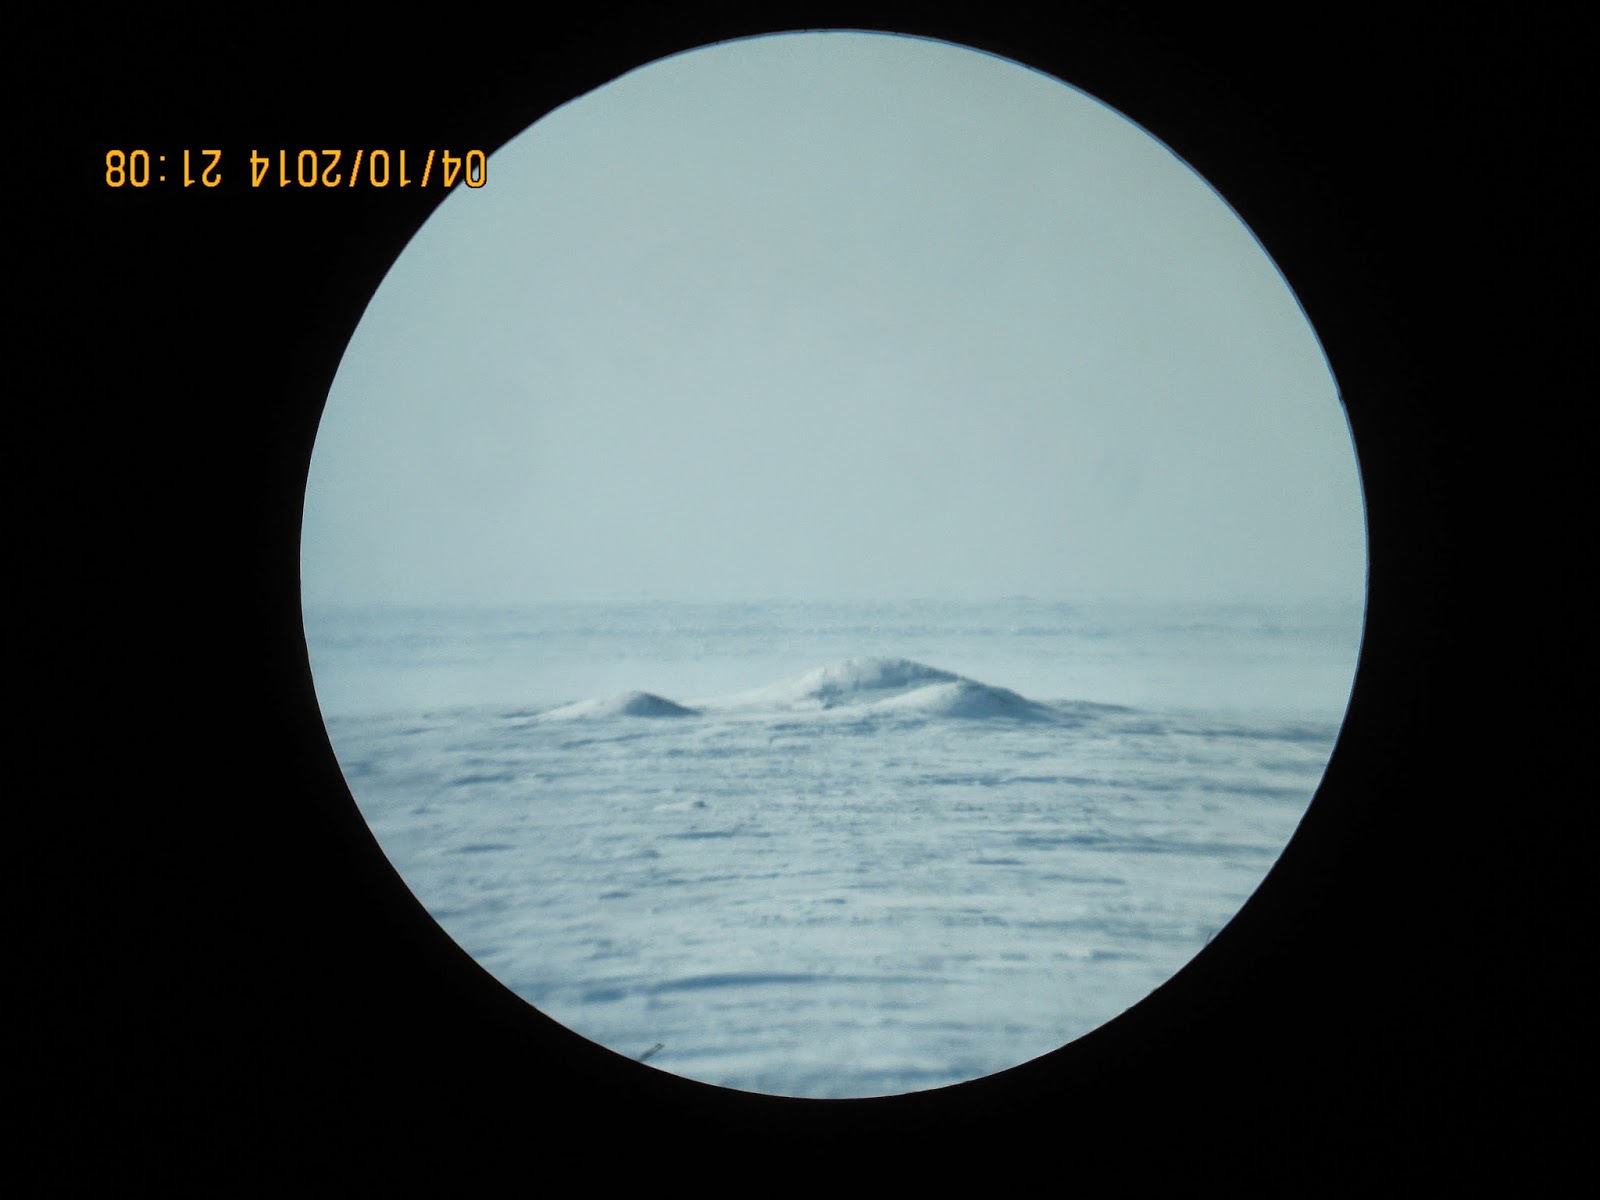
  Current spring sea ice horizon diurnal effect is likeliest due to sea ice deeper frozen core temperature cooling the top of ice more rapidly than the usual swifter double rate of air cooling caused by less sunlight.  Thermal conductivity of  ice is nearly the same as soil, and is several orders of magnitude greater than air.   There may be something else at play,  like an inversion nearer to the camera (disproved very lately),  or a diurnal temperature variation  of near bottom ice sea water column (very unlikely).   This may be why sea ice  models can't replicate great sea ice melts.  The sun and clouds are  linked much more intimately with sea ice thermal exchanges.  This is very well observed.   The famous 2007 Arctic ocean ice melt had a lot of very thick multiyear year ice vanishing under the warm higher in altitude summer sun,  the astounding speed by which very thick ice melted definitely had something to do with the sun and clear air.   It seems that sea ice may be more complicated than simple,  there are known biological interactions,  not so known thermal features associated with structural differences as well.   Here is an example, amongst hundreds, of something worth taking time to achieve a more profound study.  WD April 28, 2014

Theory vs Observations:

       Heat capacity of ice is twice as great as air,  air heat capacity is greater than dry soil.
On a normal mid latitude night,  the air cools slower than dry land,  soil cools faster,
this creates often observed morning inversions.  Eventually likely by direct contact conduction , soil cools surface air.   Not theoretically so for sea ice.   Air should cool faster than ice.  But air cools uniformly,  at any given  time,  given a starting point of sea ice temperature being the same as its surface air (the true astronomical horizon achieved),  the lowering sun should create a warmer sea ice under cooler surface air.  If so, the cooler surface air should be warmed  by the top of sea ice.   If so,  the horizon should drop.   But what is observed is the opposite,  the horizon rises.   The pictures above
strongly suggests colder sea ice than surface air.  Because multiple stacked inversions reveal near surface thermal layers,  of which the top layer is the most distant and last inversion.    If surface air cools faster than sea ice ,  the layer 1 meter above cools at the same rate as the higher ones.  Radiative cooling should be uniform.  It is highly unlikely that the layer of air immediately on top of sea ice cools faster than the immediate air layers above especially if sea ice is warmer.   WD May 4,2014.

Monday, April 21, 2014

Huge near North Pole leads

State of Arctic Sea Ice is answered,  at least near the North Pole,  in the wake of 2 significant Cyclones, multiple leads appeared so early in the season, it looks like a great melt in the making has started especially near the Russian  coast Laptev and East Siberian sea.  

   O degrees meridian North Pole leads look very similar to late May off Ellesmere when "Spring Break" occurs.  WD April21,2014

Sunday, April 20, 2014

Summer early winter 2014 Refraction and by other means Projection

~WHAT is the SCORE?
~Distinct Upper air pattern will shape late spring and summer weather for much of the Northern Hemisphere.
~El-Nino come or come later may not matter.
~Tornado season looks normal or better. Typhoons Galore not Hurricanes

    Here it is ,  the much anticipated (for those who know) howitzer of weather prediction,
the invulnerable replication of the state of the ARCTIC atmosphere when it is suppose to be at its coldest.    Refraction vertical sun disk diameters have the uncanny ability to project Global Temperatures almost always accurately.  Last year's projection #3 warmest is up in the air because NOAA and NASA contradicted each other on the actual result.

   Looking ahead: March 2014 was the warmest in history for the Northern Hemisphere so says NASA:


   But the Arctic was warmest especially Siberia:

       
   While you may be having breakfast in New England,  or by the Great Lakes,  and swear its never been colder.  The rest of the world literally baked.   Note: the coldest spot on the Planet was at times not in the Arctic but over Sub-Arctic Quebec.  

      Many Vertical  Sun disk measurements were taken during this period.  All revealed a duality,  it was very cold near the surface and very warm in the higher atmosphere. In fact,  there was  1 level out of 70 of sun disk measurement average which was found to be greatly expanded, that is from -1.0  to +6.0 degrees astronomical elevation,  as opposed to 11 all time maxima expansions out of 40 levels from 7.0 to 10.9 degrees.

     This means that the Coldest atmospheric zone is largely surface based,  not influenced by a much colder Stratosphere.  This implies a weaker North American tornado season,  in the one part because the ground air is colder,  in the other the much required colder stratosphere is absent:


NOAA   Upper Air Data is largely confirmed by the incredible lack of expanded vertical sun disks below 7 degrees of elevation during March and April 2014.

          Vertical sun disk dimensions expand with a warmer atmosphere and contract with a colder one.  Even more so near the surface when inversions are steeper and more prominent when the surface ground or ice is colder.  

 What is the score?  From 390 refraction observation comparisons with previous seasons 2002-2013:

       #1     2005                     13.64%   
       #2      2014-2013-2010   12.73%
       #3      2011                      11.82% 
       #4      2012-2009             10.91% 
       #5      2006                       10% all time maximas    

   of 110 decimal elevation degree levels2005 had the most expanded sun disk levels followed closely by 2014-2013 and 2010.  The warmest sun disk expansions in Arctic recent history (from 2002 to 2014)  all occurred during the last 5 years at 61%, compared to the previous 8 years.    If the whole Northern Hemisphere temperature remained average from year to year the yearly mean would be about 7.7%.

  NH Temperature Projection for 2014:  2nd warmest year in history without El-Nino,  #1 warmest with a new El-Nino mid-summer onwards.  


 Where will be this Summer's Cold Temperature North Pole?   
       The  C.T.N.P.  zone is actually the biggest single contributor of weather throughout the Northern Hemisphere, it is the heart of the Polar Vortex.   There is CTSP in the Southern Hemishere which does likewise.  As in March 2014 the CTNP was hanging a lot about mid central Quebec,  and gave all kinds of "normal winter of old" weather.  For the folks in NW Europe a summer CTNP at about  Spitsbergen gives buckets of rain especially over the British Isles.     But it seems likely the CTNP to hang about Northern Ellesmere and Greenland, because greater sea ice thickness over Arctic Ocean Basin has been and will continue to help spawn High Pressure systems there.  CTNP over Northern Ellesmere should mainly position the jet stream to the Northwards between Iceland and Ireland.   Although it looks like the rain will return to UK like the summer of 2012,  perhaps less than but certainly plenty grey and wet.  For the shivering Northeastern Americans,  a nice very hot summer awaits,  drier after a wet cool spring.    But it is actually the position of the CTNP which will decide where the jet stream will meander.  An Arctic Dipole will melt the sea ice greater than 2012, the North Pole will see open water,  again like in 2013 when the North Pole was actually a zone of  very loose pack ice,    but this time the sea ice will compress or compact,  leaving a wide open water view of a Pole area not exposed to open water for millennia.


Et Tu ENSO?

     Last year saw the most violent typhoon in history,  Haiyan.   Last year also had no El-Nino as well as no Hurricane season to speak of,  but there was a split personality syndrome;  El-Nino to the North , La-Nina South of equator,  this continues today:

      NOAA/NESDIS  April 17 2014 ENSO suffers again a split personality similar to last year:

Except there is a difference,  the Polar Vortex has shown a dissimilar circulation pattern to last year,  so expect a different result.  The PDO especially from the North Pacific warming is 1.6 points higher.   ENSO variations triggers weather but weather patterns affect ENSO moods.

    April 19, 2014 Polar Tropopause clouds,  higher than Cirrus some appear white some dark,   these are reflections from horizontally Polarized light,  they are a wild mix of chemical clouds, ice crystals and cloud condensation nuclei.  If they exist higher in the sky during twilight the more likely El_Nino is happening.  Right now, at about 7 degrees above the horizon they exist more from a very warm North Pacific and Atlantic,  during an El-Nino they can cover the horizon sky for more than 40 degrees elevation.

     Already in the cards,  more typhoons,  less hurricanes than normal.   If ENSO turns to be a completely formed El-Nino,   the coming winter will be much warmer grey and wetter (yes lots of rain and snow),  if the spilt personality continues (unlikely),   a winter much like the one just past will revisit but with  different CTNP persistent position,.  WDApril 20-21, 2014.

Friday, April 11, 2014

2014 NW passage consistent Sea Ice underside melt more than 3 weeks late


~Sea ice in NW passage thickest in years
~Reasons contradictory but consistent


  April 10 2014 ,  NWP sea ice horizon altitude was same as when surface temperature was equal to open sea surface temperature.  Top of sea ice was at equal temperature than the air right above,  this happens when sun rays combine with heat from underside sea water.  The ice underside melts while the horizon drops no more in altitude, this lasts  until sun beams become lower in the sky.  After that,   the horizon rises dramatically continuously till the next day usually past local apparent noon when the sea ice horizon starts going down in altitude all over again.    On April 14 actual underside melting was short lived,  an hour or so, the over all day had a strong net increase of ice thickness though.  When the horizon altitude appears at melting point for more than 12 hours,  the sea ice thickness starts to shrink from the underside.

    Last 4 preceding seasons,  the melting consistently started 3 weeks prior April 10


Super warm 2010,   sea ice was much thinner,  and had open water leads during all ice months.


     2011 was equally warm and first melt started consistently 30 days earlier than 2014.


   2012,  the year of all kinds of sea ice records,  again the
sea ice started to melt 29 days earlier than 2014.   Ice thickness was similar to 2011.


  2013 ,  the winter of clouds continued into spring, at least on the Canadian side of the Pole.  Ice thickness was similar to 2011-2012.   Clouds enhance melting especially at night,  the combination,  sun at noon clouds at midnight enhance the thawing process.


   March 17, 2014 gave a completely different perspective.  The sea ice is thicker, the sea water under it is likely colder since summer and fall sea water temperatures never warmed appreciably due to continuous cyclone clouds and the scattered nature of the ice pack which never compacted over the Arctic Ocean.

      2014 stands out very strange after more regular successive years,  but it is explainable.   Although the winter was warm for most of the Arctic Ocean,  the North American sub-Arctic was brutally cold.   This affected the Arctic Archipelago area to a great degree.  But we must go back to summer 2013 Arctic Cyclones pervasive presence which stopped the warming of the Arctic Ocean as with preceding recent years,  this allowed spreading out of loose pack ice to trigger earlier onset of fast sea ice in the fall.   The greater Pan-Arctic winter was mostly cloudier,  but without a great deal of precipitation in the CAA Arctic Basin area,  this made the sea ice even thicker during wind storms.  After end of long night, a short lived La-Nina partially triggered a cloud free period made even less cloudy by the thicker Archipelago sea ice area spurring the creation of consistent Anticyclones.  We are at this time experiencing the continuance of Anticyclones which favor ice accretion until the sun becomes too high in altitude.  There is evidence that the CAA will continue being pervasively anticyclonic until summer.  wd April 10-11, 2014