Thursday, February 4, 2021

The latest greatest rogue Vortice, North American style

 ~Whilst dying in the Atlantic a new far colder rogue formed just North of Hokkaido Japan.  

~At present Siberian dominated Polar Vortex is morphing into late winter configuration.


    26 January 2021,  the Polar vortex was seen stretched and mangled by warmth on North American side, but -51 C surface weather strong in Siberia,  above with a  -35 C 700 mb CTNP (Cold Temperature North Pole of the entire Northern Hemisphere).  North Ellesmere and Greenland paled in coldness,  at 700 mb -28 C.  But well Southwards a rogue vortice was taking shape. Now centered in the middle of Ontario Manitoba border at -26 C (all temperatures from now will be at 700 mb).  Inujuaq Northern Quebec -12 C  makes  the rogue formation imminent.  The Northern Quebec region was too warm.  January 27,  the Southern Canada vortice of Polar Vortex vortices,   seemed to stall, inching Eastwards still at -26 C.  On the 28th Imujuaq  1200 UTC holds at -14 C.  Temperatures across Northern Ontario and Central Quebec plummet.  Day 29  Niagara Falls ROGUE ahoy!   Above the 7th wonder.   Now home of the  -26 C vortice while temperatures in Manitoba and  adjoining Ontario warmed substantially.  This vortice formed a neat break from the Polar Vortex.  Like a huge blob ,  the P.V.  gave birth to a  roundish baby vortex spanning from James Bay to Nova-Scotia , from Niagara to New Brunswick.  On the 30th,  Nothing,  nearly nothing seen left of it,  remnants almost vanished by colliding with North Atlantic Gulf stream Cyclone, as usual,   it is too warm for vortices to keep whole above warm ocean and Low pressure heat.  It wasn’t a long span survivor.  Meanwhile, the greater circumpolar Polar Vortex becomes a slick roundish zone  reforming 2000 miles Northwards,  reconsolidating,  struggling to spread further South.   While the Siberian CTNP started to warm a new far East Asian rogue forms. …….  WD Feb 3 2021

Saturday, January 23, 2021

Brrrrr! Surface temperature -57 C in Siberia, the Cold Temperature North Pole Vortice of the hour, but its warmer everywhere else

 ~Siberia CTNP dominates winter 2020-21 in Northern Hemisphere 

~New Refraction method helps identify the likeliest protogenesis system causing cold air buildups. Massive cooling areas can stem by very complex geophysical factors,  luckily rendered simple by interface observations.  

~  In one feedback loop,  more snow comes from more clouds, in another loop the deep snow insulated ground cover saves the permafrost from rapidly rising reaching air in Arctic darkness, slowing the ground cooling process.    In other words,  darkness combined with lack of snow cover favors thermal radiation  escaping to space,  especially in areas far away from cyclones bringing warm air advection. 


   How does a winter area reach -57 C when it just was warmest year in history?  CMC January 22 1800 UTC surface map.  Note near sea ice shore its 20 to 25 C warmer,  


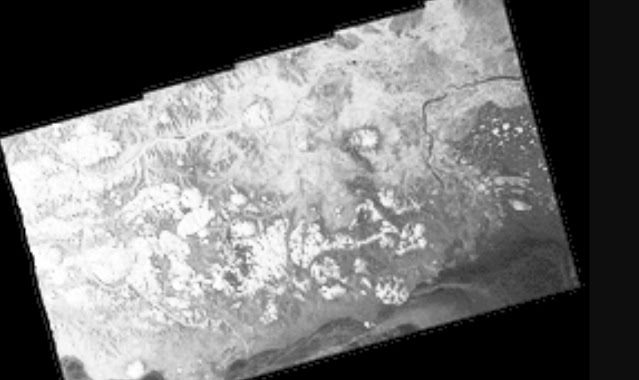
  The closest readily available Polarview SAR image to CTNP cold center,  suggests not so deep snow cover furtherest away from sea shore.   The surface temperature CTNP is North of lake Baikal,  a feature well above top of picture.   Here we see and realize that heat from the Arctic Ocean is tempered mostly by first year sea ice, undeniably a great warming source many times greater than by greenhouse gases.  

Extraordinary Refraction optical method directly immediately identifies when cold air is created, has confirmed 2021 winter far lesser capable in creating a very cold vortice on the Canadian side of the North Pole. 

        There are so many air freezing factors:  differing snow layers,  the shape of  ice crystals and snow flakes, snow density, sea ice thickness, heat from covered sea water, cloud cover, sublimation rates, winds, precipitation columns.... These factors spaced over thousands of varying in nature square Kilometers,  gives super computers a prediction deficit which most of us are familiar with.  But optical refraction observations at Canadian side Arctic subsisting over thicker snow cover, has confirmed interface warmth being greatly favored,   completely diminishing Northern Ellesmere and Greenland CTNP vortice to yield to Siberian freezing dominance.  


  Unfortunately,  we lack specific snow density data,  but Canadian Cryosphere Watch  snow cover thickness gives us some clues.  Lake Baikal area,  the current super cold spot  (grey and red) has a deficit in snow as opposed to near the East Siberian sea.   But look at Ellesmere 
swamped with snow,  in fact this Canadian  Island, usually the home of the coldest Vortice of the Northern Hemisphere,  currently has an excess of snow, a  + 100 cm  departure (purple).   The surface temperatures there are 32 C warmer than Siberian Minimum.  A more seasonal snow cover, less than 20 cm,  has dense cement like snow, leaving hardly a footprint,  making a person not sink in by a sublimation rendered  thick upper crust .   But a thicker snow layer stops the permafrost from teaming up with colder air from rapidly freezing the active ground layer, soil or rocks just below the surface.  At present this thicker snow column is sheltering a significant sugar like layer just below top thinner sublimation induced hard crust.  This granular snow,  far less dense than top crust,  prevented deep air cooling from appearing early during this long Arctic night.


     Without mid winter deep snow,  the Arctic becomes its perineal image,  very cold,  the engine of winter itself.  Must keep in mind 2020 record low polar sea ice extent and thinnest as well, along with much longer wider areas of open sea water leading up to December,  giving abnormal total precipitation columns.   Southern Siberia,  a vast area of land away from moisture sources,  is a favorably dry place.  However, as the end of long night approaches,  the role of deeper snow will flip temperature effects.   The permafrost active layer eventually will cool as much as earlier snow free grounds,  causing its thick
snow carpet density to increase in later winter,  guaranteeing a cold spring even during the gradual longer transitional sunny days,  even well after the shinning midnight sun.   

    The dye is set,  for now the CTNP will be Siberian until sun rays will rapidly warm its snowier free grounds, then so,  Ellesmere will have a bitter cold spring under the coldest vortice in the world. 

    There are so many variables causing extremely cold vortices within the Polar Vortex,  one can get lost in their causations.  But it comes down to 2 features;   the night,   over suitable favorable surface freezing conditions.  How deeply surface air cools depends on whether the interface between land/sea and atmosphere allows available surface heat to flee or to be caught in numerous feedback loops.  WD January 22,2021
       

Sunday, January 10, 2021

Complex temperature role reversal. Siberia, from hottest summer to coldest thus far winter

 ~The reign of Ellesmere and North Greenland Cold temperature North Pole has been seriously challenged

~Rather changed,  the CTNP of winter 20-21 was often found in Central to Eastern Siberia.

~Is rather an indication of a moderate La-Nina,  and something as simple as the nature of surface snow. 

    2020 will be likely #1 shared  with 2016 Global warmest year in history,  as predicted in April here,  from the same EH2r projection page a small El-Nino,  or trending El-Nino happened April-May (the sun disk refraction method expected so) then a modest La-Nina gradually came about (very difficult to predict because of this blob,  ENSO trends were strongly masked by the North Pacific warm temperature blob. One of the greatest factors of 2020 making the warmest Global temperature as was in 2016 (the year of super strong El-Nino) ,  was the worldwide diminution of pollution activities due to Covid-19.   Summer came to be hot because of this, with dire consequences including USA West coast very damaging Armageddon wild fires,  along with Siberia temperatures at +30 C.   

    Arctic sea ice extent at September minima came very close to beat 2012,  just off prediction by 1 step , #2 least expansive sea ice at minima,  this still has serious consequences though,  which brings us to the topic at hand.  Since onset of winter the prime CTNP,  was mostly centered in Siberia, a strange turn of events, the hottest Siberian summer heat wave in history, preceded the coldest spot in current winter at about the same region. It may be a matter of snow,  largely how compact it is,   in the Canadian Arctic, with snow covering the permafrost was/is strangely  less compacted (due to extensive cloud cover and record warm temperatures),    having greater insulation properties,  this should have reinforced cooling especially in total Darkness:

SAR image 10-01-21 ,  Ellesmere Island, likely warmed by thinner sea ice (black) everywhere surrounding, except its Northern most point.  A strong CTNP often hovers over this Island year round.   The dark Fjords are all with fast ice (new and thin), except for a few multi year floes.  There is apparently a great deal of snow over Ellesmere,  not having any effect on  pronounced cooling,  as one would expect.  

    While Siberia seems to have less cement snow cover:

East Siberian sea shore,  likely with a lesser snow carpet than Ellesmere,  the recently frozen sea ice (dark area), has white layers in it,  meaning different age of sea ice or ridging due to movement.  SAR satellite picture acquires some snow on land on this band,  not so for sea ice.   

    Given that sea ice was second all time lowest extent at minima,  on both Arctic continents,  why is Siberia CTNP dominating at present? 

One good reason is the lower latitude snow line on the Eurasian side, but how does Siberia super hot summer morph into the coldest neighborhood of winter?  


The other reason was explained in April 2020 as linked on the URL above,  2020 summer CTNP was largely at the North Pole,

continuing all the way to autumn,  the Eurasian flow of air was from Ural's Eastwards,  a drier atmosphere, making the sudden onset of radiative cooling with lowering sun more impactful in Russia.   There is another plausible explanation,  La-Nina and the said Pacific warm temperature blob.  La-Nina effects were largely nullified over much of North America,  because of this Temp. blob.  However, the very warm North Pacific made it warmer for North America,  certainly not giving perfect weather, because of expansive prolonged periods of cloudiness.  La-Nina however modest,  is still about,  this reduced cloud cover all over the world except East of the North Pacific.  In the Arctic,  the upper atmosphere was indeed largely dry except for the very lowest altitudes,  all that open water from 2nd lowest historical Arctic sea ice extent has certainly made the Arctic warmer and snowier,  but the Polar  upper atmosphere was consistently devoid of moisture above about 1000 meters or so.  The Canadian vortice,  usually one of two vortices forming the Polar Vortex,  got less dominant and shrunken,  while Siberia with a dryer sky cover,  with lesser clouds.  acquiring snow faster and earlier,  was sufficient to shift the location of the coldest vortice of the Polar Vortex,  to reside East of Northern Russia.  WD January 10, 2021


Sunday, October 25, 2020

Autumn 2020 great sun disk expansions, a measure of current extreme warming on either land and sea.


October 21 shots, with vertical diameters of 30.1 arc minutes at 1.5 and 1.2 degrees elevation,  Pretty much as expanded as can get,  surely an Arctic record. This came as fall measurements,  not frequently done because of increased moisture clashing with lesser solar radiation,  started with normal vertical diameters,  then a mid October warming caused this anomaly.  Entirely due to record low sea ice extent and re-injection of heat from the record warmest Arctic Ocean to the lower atmosphere.
These captures also indicated the viable existence of anomalous atmospheric warm spots,
 not mixed yet with the overall wider encompassing likely cooling Autumn air.  A rather infrequent observation while monitoring sun disk diameters.  The more expanded the vertical disk the warmer the air,  in fact its the most accurate measure of total atmospheric temperatures I know about.  2020 sea ice extent minima narrowly missed beating 2012.  But the current nature of remaining sea ice is overall thinner, therefore 2020 at this time is lowest extent in history.   A true indicator of unrelenting further melting in the cards. The implications lesser se ice are felt throughout the Northern Hemisphere,  the physics of which will be explained in subsequent article.  WD October 25 2020


Friday, August 28, 2020

Wretched state of sea ice in unfamiliar sector can accelerate flow exit towards Greenland sea

~A large water anomaly in the Greenland to Pole sector may cause even more exodus of sea ice

~2 nautical miles a day is about the average flow of sea ice,  with open water about this speed  easily can be multiplied quite a lot.

~83 North 8 West open water anomaly just had 20 km displacement in 2 days 3 times the normal speed:

     Astounding North of Greenland open water zone has just facilitated a massive displacement of sea ice,  which may not be read as melting,  but will surely result in greater melting.  


   CMC 0600 UTC  surface analysis displays a normal general circulation picture for late August,  which may result in even further melting results.  Of Note centre 1035 mb High  has clear air at its core centre, which indicates a switchover to fall scenario.  A similar in position long standing High pressure in June had mainly cloudy skies making remote sensing analysis difficult,  not counting as well the cloud saving nature it had of preserving sea ice.  Late August 2020 surface temperatures are also very warm, this will further delay the minima sea ice extent date.  WD August 28 2020

Monday, August 17, 2020

Slow cloud induced last month melting surprise

 ~ The speediest melt rate since 2012 and 16 slowed by weather dynamics is not quite finished surprising yet

~The current latest melting appears innocuous but is huge

August 13-17 North Spitzbergen   50 Km Resolution:

   Impressive Northwards massive melting despite wind flowing towards the South (roughly towards the right).


   Goodbye Waves Russian side morphing rapidly on Center Russian side of the Pole.  Somewhere about 10 km square melting.


WD August 17 2020


Friday, July 31, 2020

Megamelt in progress despite normalized circulation

~All experiences just gathered has helped depict the near future sea ice of the Canadian Alaskan sector of the North Pole; it is melting extremely fast,  most of it will vanish.
~The current weather circulation pattern is what one would expect for this time of summer
~Nearly 3 weeks long anomalous High pressure centred on Pacific side of the Pole induced ice flow has stalled and or reverting in the opposite direction,  giving the illusion summer 2020 melt has stalled,  but it is simply changing course. 


NASA EOSDIS North of Alaska and Beaufort sea ice has dramatically changed state from  somewhat steady consolidated pack to extremely unstable about to melt all pattern,  in a matter of 7 days.  It means the ice was very thin but strong enough to keep up appearing normal on the 24th of July.   Preceding experiences of today's event, as you can read previous recent EH2r articles,  basically foretell a massive area,  the Arctic Basin Gyre zone liquid sea surface is about to resurface again from the veil of its ageless ancient perineal cover. WD July 31 2020

Friday, July 24, 2020

North Atlantic hyper melting ; when sea ice is a pack it can easily go into warm waters

~North Atlantic slush front
~Day fast changing Goodbye Waves


   EOSDIS July 23-24 2020 North Atlantic by Franz Josef Islands,  total chaos reigns,  as the loosened  ice pack heads towards warmed surface waters,  massive melting ensues.    Note the rapid disappearance of goodbye wave geometry in 24 hours,  in particular the ice about vertical striations middle of July 23 capture,  the G.W. morph in shape very rapidly,  an indication of hyper speed melting.  WD July 24 2020

Sunday, July 19, 2020

Laptev sea: Extreme melting in the middle of a pack

~Again a rare sight,  contrary to usual water engulfment,  sea ice melts in the middle of a pack
~This loop offers an explanation of the warm High over the Arctic Ocean,  sea ice on the Russian side of the Pole is much thinned. 


   Laptev sea ice melt speeds continue to impress, at right we have astounding example,  usually sea ice melts when the ice pack is scattered, and pans of ice are prey to surrounding warm surface water.  Not in this case, sea ice is melting from within the pack.  The loop sequence below captured the jutting ice pack at centre (right);


   This middle of Pack melting is unusual, but strongly suggests very thin sea ice.  NASA EOSDIS July 15-19 2020.  Now this helps explain the stubbornly persistent High pressure over the Arctic Ocean.  Usually at what I call "Arctic switchover"   a winter/summer switching of roles occurs between anticyclones and lows,  whereas cyclones tend to gravitate where its coldest,  as opposed to Highs which tend to place themselves at the warmest spots,  top of Greenland excluded due to obvious reasons.  Switchover 2020 occurred in good time at about mid June,  but at end of June appeared this anticyclone where a cyclone should be.  One explanation was very hot advection from Siberia, the other reason is that the sea ice from Pole to Russia is exceptionally thinner.  This would allow a High to settle over sea ice, having a surface  always colder than land, but thinner sea ice has another player,  thermal radiation from the underlying sea may very well be the key in allowing this High to exist, an Arctic High pressure system may be stable if literally underlying heat input is similar to land.  WD July 19, 2020

Friday, July 17, 2020

Laptev Sea melt madness, Goodbye Waves have no time to be artistic

~ Most dramatic record pace melting on Russian side of Pole
~Visual record shows particular "Goodbye Waves"


NASA EOSDIS July 12 to 17,  Laptev sea ice retreats at stunning speeds,  mostly by melting, as exemplified by Goodbye Waves,  not having a chance to twirl and be creatively beautiful.    Never noticed this before on such a wide scale.

East Siberian sea during the same time period,  thawing is just as frenetic,  the G. Waves  are likely from much thicker sea ice pans,  so the twisting around or final act of sea ice can be seen.   We can indirectly surmise what kind of ice it was by the last moments of its existence or life,  a pan of sea ice includes a world of beings all dependent of it.  WD July 17, 2020