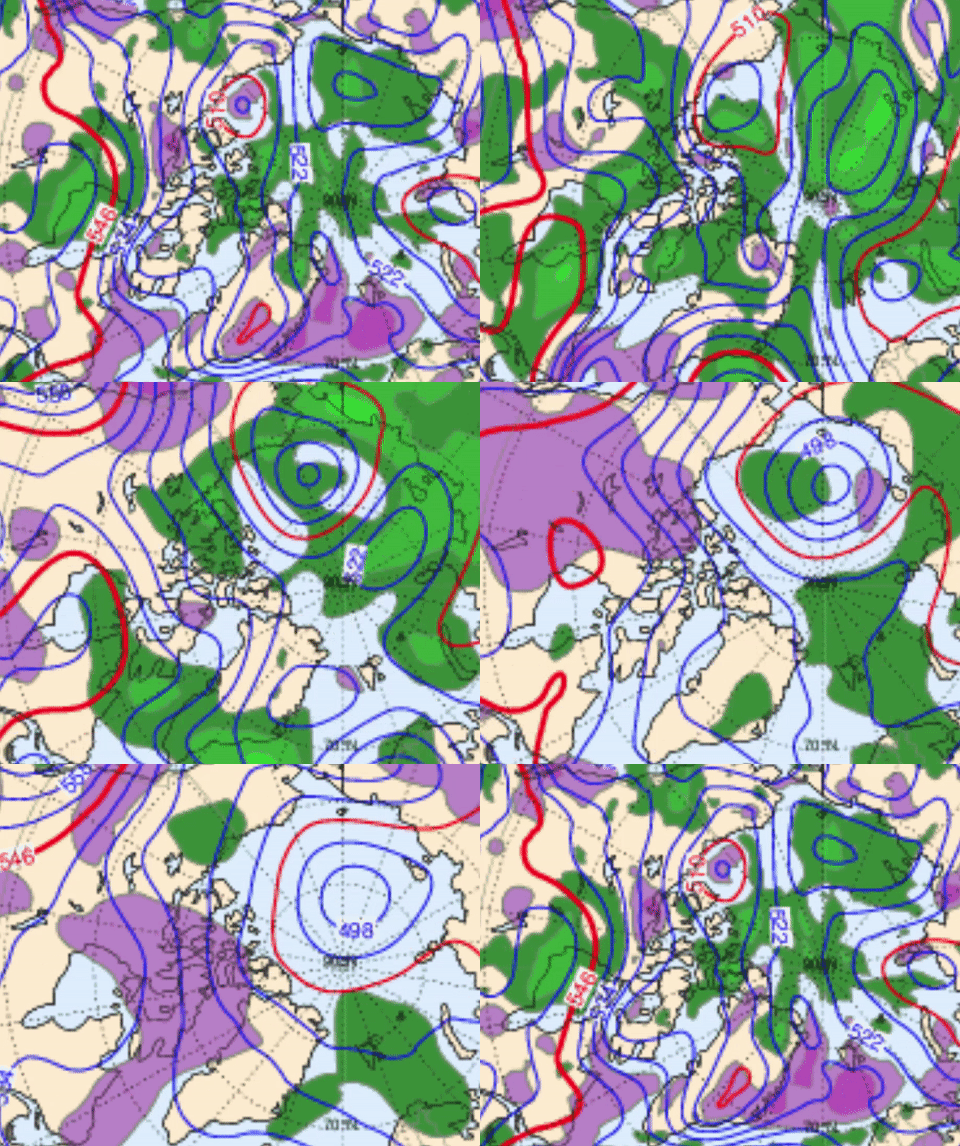
~Polar vortex is the entire spinning of the Polar lower troposphere like a cyclone
~Vortices created within, sometimes one , two 3 or 4. Move about.
"A polar vortex is an upper level low-pressure area, that lies near the Earth's pole. There are two polar vortices in the Earth's atmosphere, which overlie the North, " Wikipedia
Not only 2, there can be many vortices. This article from science alert is very good:
http://www.sciencealert.com/it-s-official-the-polar-vortex-is-back-with-a-vengeance
When there is an incursion of warmth towards the Arctic Ocean, like at the moment the vortices are pushed Southwards:
Northwards of Green delimited zone is the Polar Vortex of the entire Northern Hemisphere as expressed by NOAA 500 mb heights map December 15, 2016. Consisting of 3 vortices centers in dark purple, note to the right of each smaller vortex there is a Northward flow of air, to the left a Southward flow, yes it is cold in North America however very opposite warm NW Europe. When a TV meteorological presenter says the "Polar Vortex" is back, he or she means a single smaller vortex part of of the entire Polar Vortex system. There is apparently no single word for 'vortice', hence the confusion of using Polar Vortex. Another way of presenting the case would be to say that the Polar Vortex is weaker, hence less circular, oblong and segmented by severe warming near or towards the North Pole. A single segmented vortex usually wraps the jet stream stream around it:
December 16 2016 CMC 250 mb chart. Blue trace my own. Within the blue trace is the center of vortices, there lies a surprise, it is the Cold Temperature North Poles. The coldest air possible.
CMC 500 mb chart December 16,2016. Although ideally the temperature of the entire troposphere is found by a 600 mb chart (they are rare, can't find). We can clearly read -51 C close to Great Whale river Northern Quebec, this is the center of the coldest air in the Northern Hemisphere, note Ellesmere 1500 miles North, -30 C. At center of CTNP the winds are weak to none, similar to center of hurricane but on a mega monster scale.
It may said that it is colder further South than the Arctic, these are the days when winter builds up over the continents, the Arctic Ocean atmosphere being much warmer affects the weather every where Southwards, the term Polar Vortex should be explained more correctly because this implies a Colder very expansive Polar region, in fact its warmer at the North Pole devoid of any sun light whatsoever.WD December 16,2016
Friday, December 16, 2016
Tuesday, December 13, 2016
Dramatic Arctic Warming captured with ice extent and temperatures: Area under the DMI 80 temperature curve biggest in 2016 in direct relation to substantial daily open water area.
Average Arctic Ocean surface temperatures have a close relation to either sea ice or open water total areas.
These three measurable geophysical parameters are inseparable, they cause and effect each other to vary. The easiest one to immediately visualize is open water, dark, but warm especially in winter.
The period of greater demise for Arctic sea ice started in 1998, if we integrate the space under the DMI 80 N temperature red curve vs average in green, we may get a correlation with respect to open water extent. Note 2013 the last year with expansive sea ice after minima, the red closely hugged the green more often. Note the years 2016, 2012, 2007 and 2006 being particularly ocean blue with a largest integrated temperature areas matching open water extent or are very well reversely proportional with their lowest sea ice extents. 2004 temperature area integration is close to 0 which coincides with 2004 ice extent being pretty average. The pre 1998 curves appear to have a consistent integration much closer to 0 or less:
What we may conclude from these mental integrations: there's a hard road back to normalcy for sea ice to rebuild, if not an irreversible downward extent trend particularly demonstrated by a very large, the largest under temperature curve integrated area in 2016, indicating much more open sea water, it is exceptionally foreboding. WD December 13, 2016
Friday, December 9, 2016
From warm year to warmer: A different icescape world in 5 years
Sea ice greatest feature is the recent memory it encapsulates, it is planet Earth's graph displaying not only daily but more monthly/yearly trends:
2016 has Myriads of very small leads interspersing countless thinner broken up sea ice pans. A much more fluid ice pack, not really amenable for mega lead formations. The more frozen areas of 2016 pack has some much smaller mega leads. We are very close to winter solstice, if this badly broken up sea ice pack continues till Maxima date, 2017 summer sea ice prospects look very bleak. The badly broken up sea ice state is deeply intertwined with a feedback loop enticing Cyclones to persist over the long night Arctic Ocean, these keep the sea ice from accreting normally, keeping the pack loose. This long night may be the starting time when sea ice extent variations simply will stay down year round. WD December 9,2016
Sunday, December 4, 2016
The "Perfect Storm" 1 month late minus the hurricane merge
"Here we are in the graze of winter"
John Mellencamp
the time was October 31 1991:
Winter's moved in, what they call an "Arctic blast", changed the configuration of the entire North American weather map. Very bitter cold. This in part created the Perfect Storm of Andrea Gale fame, ode to the fishermen of NE coast who braved it.
2016 has same winter blast, much weaker, is a coming 40 days late:
ECMWF portrays coming High pressure "Arctic dome" originating mainly from Alaska,
a pale shadow of former self, while the Arctic Ocean is currently dominated by a Cyclone which just kicked out a budding mega cold "dome" forming, the by-continental merge of cold air zones was cut in two, leaving Alaskan build up to come down the Rockies path. However, on the East coast of North America, a huge Cyclone system will blossom December 9-10 not unlike segments of the Perfect Storm of 91, but minus Hurricane Merge, December being well past hurricane season, the last one Nicole streamed by Mid-October 2016.
Last 30 days (from December 7) NOAA temperature anomaly. North America is not as cold as old November's use to be.
We have an "Alaskan Cold Dome" slowly moving South, looking very similar to the 1991 chart above, 40 days late from the Perfect storm date. Winter is starting late. CMC 0600 UTC 12/08/2016. WD December 8, 2016.
Saturday, November 26, 2016
Late one sided winter start, example of what thick sea ice did regularly months earlier, and what happens later when less sea ice is looser pack
We follow here the progression or regression of the first dominant Anticyclone to cover the Arctic Ocean. In the Past , Siberian cold continental air easily invaded and teamed up with the other side
of the world cold dark clear air massive buildups, the beginning of cold dark winter didn't take long to be felt by millions once they merged. Now we see first hand the further demise of early winter:
For weeks, there was no wide spanning Highs over the Arctic Ocean. Now we can surmise the numerous leads amongst thinner sea ice finally freezing. I watch carefully how strong or enforced this North Pole High will be. The cold gathered in Siberian darkness wages the spread of winter from darker lands favoring radiation to space. In Northern Canada, the Pacific and Atlantic Cyclones continue the warmth initiated by the great sea ice dispersion event of early September just past. WD November 26,2016
Next day November 27 show a retreat of the High whence it came, back positioning because Cyclones have influenced the jet stream favoring their return to the Arctic Ocean, made easier by the warmth still present, the jet stream is bent along the Eastern Greenlandic line easing the return of North Atlantic Cyclones.WD November 28,2016
November 28 key Cyclone position Northeast Greenland is a slingshot for the next one to the South, North Pacific Cyclone conspires to do the same, the Siberian High is much thinned but still resisting the perimeter assault.WD November 29 2016
November 29 Push and Pull is in, the Cyclone NW of Canadian Archipelago coast has severely weakened the Siberian High, all while partner from the North Atlantic did the same. Not really apparent, the High pressure SE of Greenland has injected tremendous heat Northwards abetting
the push to destroy the Siberian Antiyclone. Again the Cyclones have hanged about Arctic Ocean locations which warmed the most over summer past. Coup de grace is about to finish the Siberian cold, the NW archipelago Low will pull in the Atlantic Low , soon the entire Arctic Ocean will be back to clouds and Low pressure warmth. WDNov30,2016
Gone, the once proud High pressure zone spanning the entirety of the Arctic Ocean vanished Day November 30. Ever present Arctic heat has encouraged warm air Advection not only from the seas, but from Northern Canada. This is quite unusual, even 2012 had no such event in Early December darkness. The temperatures of the entire Troposphere in 2012-13-14 -15 spanned much colder all over the long night. Americans and Canadians don't know yet how warm this winter is setting up to be. But they already have had a very warm start of winter, no sign of industrial planetary sized cold air production even in Eurasia. Every location is geo-meteorologically linked. Here again suggests warmest influence from the oceans. WD December1,2016
Thursday, November 24, 2016
Unprecedented Arctic Ocean surface Air warming and computer modeling, are they integrating the sea ice current morphology?
First the unprecedented warming bit. Autumn early winter 2016 outclasses all others. DMI North of 80 surface temperature s easily beat 1998, 2007 and 2012 by very wide margins.
We should apparently use this model to predict the next season minima with 66% confidence:
Fall 2011 DMI really didn't give a hint of the coming 2012 summer season melt. 2006 fared quite well, 2015 not so bad.
ECMWF 500mb animation, next 7 days along with 2 other models, GFS and CMC , all agree that the incoming Cyclones from the North Atlantic will not happen. Note the lack of steady position of the 500 mb Lowest thickness. 500 mb is used here to find the coldest column of air about . If the 500 mb lowest height was around Southern Greenland, there would be great flow Northwards.
Monday, November 21, 2016
Arctic Ocean air in total darkness enormous warmth, even in clear skies with partial North Atlantic air advection.
~Only one thing does that: ocean heat.
CMC Nov 21, 1800 UTC, Surface Analysis. Total darkness, varied in location -4 C to -20 C Arctic Ocean temperatures are extremely warm as a whole. In particular Buoy 48276 , -12 C 85 N 90 W, a place where -30 C is common at this time of the year. What we see there is a great number of leads, where once was the densest thickest sea ice, the engine that spurred winter to roar is now mainly cooled from the South, the only advection there is cold from land. The 1024 mb High is not conducive to warming in darkness as well. The only thing left is the warming from thinner sea ice and these leads, which under clouds, or making clouds, keep the surface air on top of sea ice warm.
NOAA HRPT November 21 1500-2200 UTC IR animation. The warmest air as seen on surface analysis was below denser clouds, but the open air has absolutely no other heat source but from the Ocean.
2016 November great Arctic Ocean anomaly is a "dry run" of what an open long night Arctic Ocean would look like. Cooling in Darkness would take place over Canadian Islands and Greenland, this bends the Jet Stream Northwards on the East side of Greenland, effectively driving warm air Cyclones to the North Pole. In today's current situation, multiple leads amongst thinner sea ice don't freeze over as rapidly compared with vast extent of older much thicker ice causing deeper quicker freezing and the build up of Anticyclones. The current flow from the North Atlantic slows the onset of a normal winter considerably. The new presence of multiple leads dispersed throughout the Arctic Ocean, as opposed to in parts as during previous recent warm years, is similar to a wide open Arctic Ocean, much tamer now, but driving the circulation to keep the leads open, or in the future, to maintain sea water wide open. WD November 21, 2016
Saturday, November 19, 2016
Dispersed, emaciated, heat diminished sea ice barely holding together as once upon a time. 1988
28 years ago, Mid-November 1988, sea ice was fierce, consolidated, encouraged the build up of winter. Its ice was expansive , all the way to Spitzbergen, North of Ellesmere it was the world
of the big lead, a lunar phased tidal break up, it was also the time of the famous ring barrier, a cousin of the big lead, between Northern most Ellesmere and North-Western. 1988 IR picture above was bitter cold white, signifying a normal -30 C or colder. 2016 note day after , November 18,shows the ravages from a warmed planet. The Big Lead does not form because sea ice is extremely de-consolidated. One Japanese North Pole expedition the following year, was on ice, just off Ellesmere, a huge sound was heard by all, like thunder for hours, very scary noise. It was the Big Lead, opening, freezing and closing up again within 2 days. The well equipped expedition shortly thereafter encountered a wall of broken up sea ice shingles, 10 meters above the ice plane, 1 Kilometer wide along the course of the coast for as long as eyes can see. It took them 1 week
to get through the big lead wall, 1 kilometer a week speed. 2016 offers no such icescape.
November 17 1988 IR NOAA capture, note sea ice temperature as white as the land features. Meaning , winter was normally huge, spread out From Russia to Canada. A completely different world of weather.
November 18, 2016, whatever is cold is over Ellesmere and Greenland, with very little sea ice freezing as much as 1988. Cyclones dominate the Arctic Ocean. Spitzbergen is surrounded by open water, the strait between Northern Ellesmere and Greenland has loose pack ice, no tidal ring forming. WD Novenber 19,2016.
Wednesday, November 16, 2016
2016 Warmest mid-November Troposphere
Day November 14 , 2012 through 2016, a snapshot in time at 600 mb (close to the average temperature of the entire troposphere). 2016 easily exceeds 2012 in warmth, note where the
densest sea ice should be, North of the Canadian Arctic Archipelago, 2016 warmest by 10 to 12 C.
It is an undeniable reflection of the state of sea ice, swamped by mainly Atlantic cyclones, which have dramatically slowed the refreeze, but a stronger presence of thicker sea ice with less leads do the opposite, repulse Cyclones.
The year for Nov 14 with the lowest expansive Arctic Ocean Pressure was again by far 2016.
WD Nov 17, 2016
Tuesday, November 15, 2016
Dark Horizons, latest cutting edge refraction analysis
~ New equipment allows to capture horizon with sun as low as -11 degrees below A.H.
~Very latest data suggests 2016 has exceedingly thin sea ice.
A series of observations on the ground and within the air itself may help explain surface based thermal inversions, of which a significant player is sea ice and snow cover.
Darkness offers ideal thermal flux studies, largely because inconsistent rapid changes by clouds and sun radiation from varying elevations can change the thermal balance quickly. Without the sun, we can literally see how thick sea ice is because the only heat source is mostly from the Ocean even if covered by ice and snow insulation. If sea ice is thinner, more heat escapes from it by conduction, convection and IR rays. But the very top of sea ice surface can have the same temperature but was never observed warmer than surface air, triggering a prime optical refraction rule: - top of sea ice is always colder or equal in temperature to surface air- , as observed in all observation captures so far, this is just as so in darkness as well.
It is also known that the upper air temperature profile maximum point increases in altitude in direct proportion to how cold the lower atmosphere is. The higher the warmest air layer altitude is on a given upper air profile, the lesser it can influence the surface temperature below, the steeper the surface based inversion usually becomes, in optical response the horizon rises. Warmer oceans than air right above always cause the surface to air interface to be adiabatic, freezing of sea ice surface marks the beginning of a different lower atmospheric profile, isothermal at first, then progressively after, surface based inversions start to dominate and eventually persist all winter except for advection from long night Cyclonic intrusions.
November 11 2015 (darker image), had about 1 arc minute higher horizon elevation compared to 2016 November 15. As such, Nov 2016 had warmer temperature -20.3 than 2015 -24.5 C. Photo captures were done with older telescope (darker image) and more powerful newer telescope (brighter image). So far, all comparisons with previous years in brighter very early February captures suggest a very thin sea ice at present. WD (Nov 15,2016).
Subscribe to:
Posts (Atom)