January18,2016. Sea ice horizon in darkness, a perfect way to study radiation fluxes. 2015-16 was a warm winter, it had thinner sea ice, but more snow , 40 cm, a proxy for sea ice making it thinner. warmth and snow made sea ice more than 30 cm below sea average.
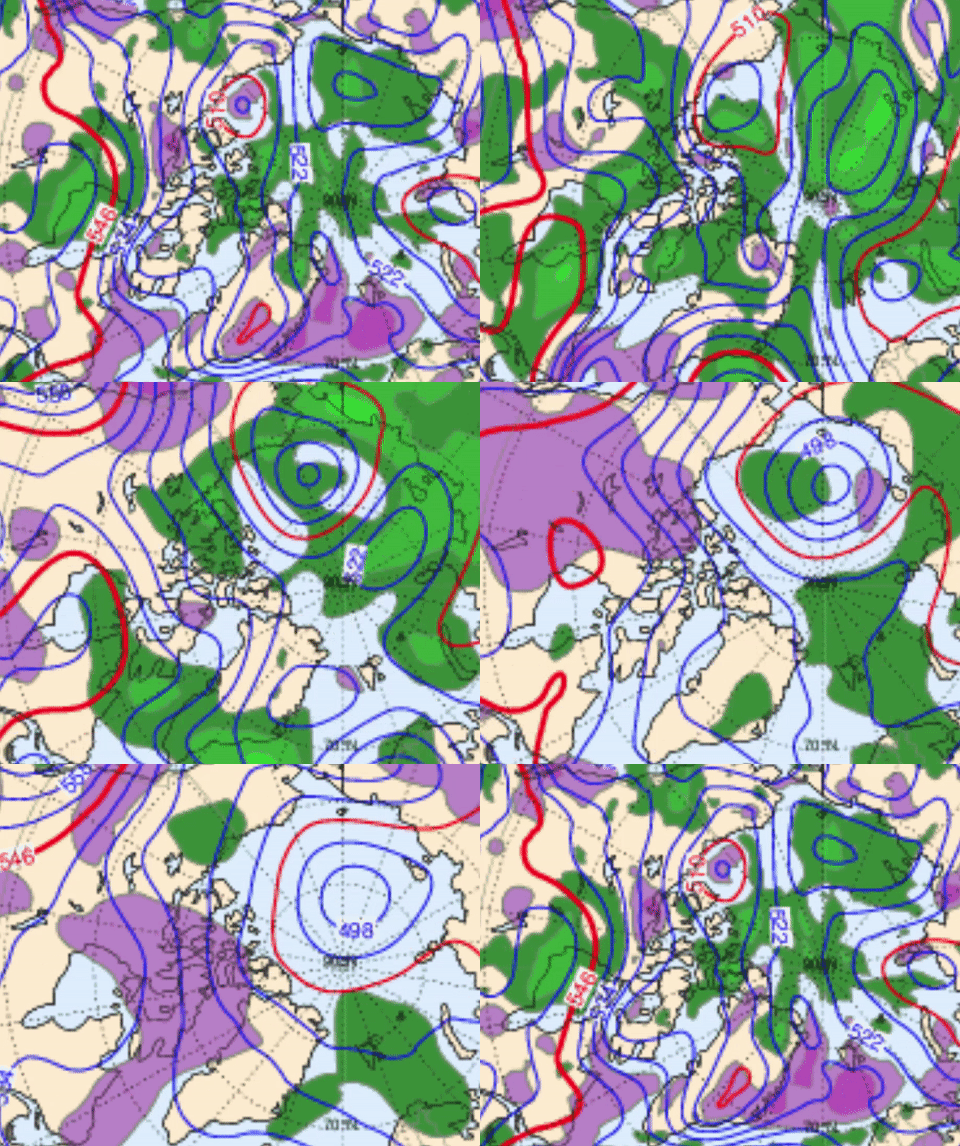
To make out the meaning of the latest results we must study the over all circulation picture courtesy NCEP/NCAR , the following are model maps of 600 mb temperatures, at about this altitude we can determine the temperature of the entire troposphere which varies from one geographic point to another. I find these maps helpful, but we must keep in mind that there are no upper stations over the Arctic Ocean.
Thinner sea ice circulations: We remember 2013 melt season; like one large Cyclone throughout the summer. 2016-17 long night circulation was Longitude 90 Degrees-North Pole- Longitude 90 degrees Russian side extending longitudinally Eastwards , an "L" shape . Mean Vortices of the Polar vortex locations of 2013 were split in 3, The winds rotate counterclockwise around the coldest air, the Blue zones. This 2013 circulation pattern favored a much colder Eurasia, mildly colder western North America. In 2016-17, the vortices have migrated Southwards, a reflection of thinner sea ice during winter, the average here for North American sector does not represent this well for this sector. With this Polar Vortex pattern, NW Europe has a larger input of Cyclones from the Atlantic, more snow for the Northern Eurasian region, unlike last winter these Lows tended to crash towards Novaya Zemlya which made for greater precipitation in that quadrant. A strong vortex (not seen here) hovering about the Canadian Archipelago, in particular West Greenland Disko Island, helped pull Cyclones towards the Pole. As a result, 2016-17 circulation for the Canadian Archipelago has had far less snow than last year. The snow maps indicate a great layering from Pacific moisture East of the Siberian Vortex, the coldest of the season so far.
The average Low Pressure footprint from the North Atlantic 2016-2017 dark season so far. The zones with Higher pressure were over the continents where the greater cooling took place.
Last season 2015-2016 had lower pressure average North of Ellesmere. North Atlantic Cyclones died there, now they are attracted or steered by the greatest of the Polar vortex vortices, the Siberian one. But the Arctic Ocean laced with water, much thinner ice, "attracts" Low pressure systems just as much as last winter. Some linger and die over the Pole, while they do, the clouds outright warm everything to huge anomalous temperature gains. From greater open water/thinner sea ice heat flux the Lows die slower, while they do, they "invite" other Northward Lows to replace them, because the shaping of the jet stream is to the North mainly over the Gulf Stream, a huge steady source of moisture. The smaller vortex of the the Polar Vortex vortices, was mainly centered over Baffin Bay, although migrated North or South from that location. This heavily shaped the North Atlantic Jet Stream to bend Northwards.
Warming of the entire Arctic recorded by optical method:
The continuous onslaught of Cyclones Northwards along with the much more open sea water and thinner sea ice had a huge unprecedented effect on the atmosphere, land and frozen or open seas:
January 19 2017, it has been seasonably colder -33 C for about 4 days with a peak dip nearing -40 C, a departure from overall much warmer winter. The sea ice horizon from November 2 past, rose 3.5' of arc, a significant drop in height during total darkness compared to last year. A lowered horizon is always characterized by a lesser temperature contrast at the surface to air interface, this latest observation is a strong indication of more heat on the surface which warmed cold clear air more than last year. The best way to explain this is 2 blocks of equal volume of identical matter, one at higher temperature, the other at air temperature, the immediate impact of the warmer block would be to raise the temperature of the air next to it. Likewise, after months of mostly cloudier High Arctic weather, effectively reducing thermal radiation escaping to space, along with greater heat injected by open water and thinner sea ice, the land and sea ice has a net warmer presence, this translates in a lesser temperature contrast reducing horizon heights.
Just at the clearing of clouds, a few days prior, the data was even more compelling:
January 14, 2017, a day after the persistent clouds cleared, it was -37.1 C, a near 20 C drop in temperature occurred, at this point, the horizon was 1.84 arc minutes above the November 2 2016 just freshly made new sea ice. This basically demonstrated the long night cooling slowed substantially, late in dark season ground surfaces offered a lot of residual heat reducing interface cooling. The net refraction difference in altitude gain was a very significant -3.41 arc minutes between 2016 and 2017. This is without interference from winds , clouds and with similar seasonal colder temperatures. To confirm this pervasive warming, a few hours later, planet Venus set over a hill:
South of Cornwallis land , air, ocean and sea ice, all where measured warmer than usual, the exact impact of such geophysics so late in the long night can only make the coming weather days predictively warmer. WD January 20, 2017


