Friday, April 11, 2014

2014 NW passage consistent Sea Ice underside melt more than 3 weeks late


~Sea ice in NW passage thickest in years
~Reasons contradictory but consistent


  April 10 2014 ,  NWP sea ice horizon altitude was same as when surface temperature was equal to open sea surface temperature.  Top of sea ice was at equal temperature than the air right above,  this happens when sun rays combine with heat from underside sea water.  The ice underside melts while the horizon drops no more in altitude, this lasts  until sun beams become lower in the sky.  After that,   the horizon rises dramatically continuously till the next day usually past local apparent noon when the sea ice horizon starts going down in altitude all over again.    On April 14 actual underside melting was short lived,  an hour or so, the over all day had a strong net increase of ice thickness though.  When the horizon altitude appears at melting point for more than 12 hours,  the sea ice thickness starts to shrink from the underside.

    Last 4 preceding seasons,  the melting consistently started 3 weeks prior April 10


Super warm 2010,   sea ice was much thinner,  and had open water leads during all ice months.


     2011 was equally warm and first melt started consistently 30 days earlier than 2014.


   2012,  the year of all kinds of sea ice records,  again the
sea ice started to melt 29 days earlier than 2014.   Ice thickness was similar to 2011.


  2013 ,  the winter of clouds continued into spring, at least on the Canadian side of the Pole.  Ice thickness was similar to 2011-2012.   Clouds enhance melting especially at night,  the combination,  sun at noon clouds at midnight enhance the thawing process.


   March 17, 2014 gave a completely different perspective.  The sea ice is thicker, the sea water under it is likely colder since summer and fall sea water temperatures never warmed appreciably due to continuous cyclone clouds and the scattered nature of the ice pack which never compacted over the Arctic Ocean.

      2014 stands out very strange after more regular successive years,  but it is explainable.   Although the winter was warm for most of the Arctic Ocean,  the North American sub-Arctic was brutally cold.   This affected the Arctic Archipelago area to a great degree.  But we must go back to summer 2013 Arctic Cyclones pervasive presence which stopped the warming of the Arctic Ocean as with preceding recent years,  this allowed spreading out of loose pack ice to trigger earlier onset of fast sea ice in the fall.   The greater Pan-Arctic winter was mostly cloudier,  but without a great deal of precipitation in the CAA Arctic Basin area,  this made the sea ice even thicker during wind storms.  After end of long night, a short lived La-Nina partially triggered a cloud free period made even less cloudy by the thicker Archipelago sea ice area spurring the creation of consistent Anticyclones.  We are at this time experiencing the continuance of Anticyclones which favor ice accretion until the sun becomes too high in altitude.  There is evidence that the CAA will continue being pervasively anticyclonic until summer.  wd April 10-11, 2014

Saturday, March 15, 2014

Sun line announces the return of persistent Arctic Anticyclone genesis

~ Spring 2013 had a remarquable period of persistent Cyclonic activity caused by adiabatic surface to air profiles.

~ 2014 already looks quite different

    Considerable effort drove me to determine the reason why Arctic 2013 was so much adiabatic in nature.  The very reason why Cyclones were extremely prevalent especially
from the spring onwards,  ultimately leading up to affect the sea ice minima,  by severely reducing sea ice compaction,  in effect stunting a sure to be greater melt than 2012.  Adiabatic air welcomes cyclonic invasions,  while stable much colder surface air acts as a barrier,  a wall against cyclonic penetrations.

    As you may read my spring based 2013 projection as seen on top of www.eh2r.com ,
the cyclonic activity to come was observed quite entrenched by affecting refraction effects.  Adiabatic surface to air interface dominated spring 2013 so strongly that I was certain and had no doubt that this feature will continue.  However,  early 2014 refraction optics show great evidence of the resumption of more normal Arctic Archipelago weather,  having a greater balance between adiabatic and stable upper air profiles.  In no
small part due to thicker sea ice between the channels caused by summer 2013 not having a great deal of sun ray heating of the sea by the everlasting presence of clouds
which permeated the entire 24 hour sun light season

     Triple Green flashes (seen red because of the filter) on top the much flattened setting sun of March 15 2014.    Clear signals by the heavily stratified nature of the lower atmosphere,  a sign that sun rays traversed an anticyclone.


    Same day right after not so famous but awesome sun line,  not seen like this so bright and strong for years.  
   The sun here is seen entirely compressed about 30 times.  Looking like"fire on the ice".
The sunset ended -2.23 degrees below the astronomical horizon.  Below -2 degrees sunsets were quite rare over the past 8 years.  The thicker sea ice of the Northwest passage cooled faster after a day of sunlight hitting it,  this created many isothermal layers right above,  since air didn't cool as rapidly,  ideal conditions existed for refraction ducting.  

     The basic difference between 2014 and 2013 is a presently colder Archipelago influenced by a a very frozen continent to the South,  in part created by strong albedo action from last summer overwhelming presence of clouds associated with persistent numerous cyclonic incursions.   This long streak of cyclonic activity is currently loosing steam because the local sea ice in a large area is healthier thickness wise,  at least around the archipelago, which is  a much colder area than the rest of the present day Arctic which has had a very warm winter.  The resultant after effect of newish anticyclone genesis should eventually  trigger the return of  more sun rays reaching the the most frozen side of the Arctic.  But since there is a temperature dipole in place, the rest of the Arctic Cyclones should continue enveloping the anticyclonic colder zone.  The very existence of stable air at the surface over the cold area will move about its source,  in effect creating more compaction,  and surely a lesser sea ice minima than last year.  WD March 15, 2014


Thursday, March 6, 2014

Warming in the Arctic blasting cold waves Southwards?

~ Apparently the Arctic can do 2 things,  either it has a deeply frozen atmosphere  spreading outwards or be warmer at once.
600 mb temperatures closely represents the temperature of the entire troposphere.  Courtesy NOAA.  February 1982 (left)  Arctic Atmosphere was extremely cold almost covering the entire Arctic
while February 2014 (right) was substantially warmer,  with a much weakened Arctic Ocean winter.   Lame ,  more than twice smaller.  


How can most presenters claim Arctic blasts  lowering the temperatures enough in Eastern Mid North America to almost freeze the Great Lakes completely,  when a really cold historical Arctic had less an effect on the same lakes?   The answer is spatial compression and also a greater potential of heat radiation to space over the continents primarily because the continents cooled more readily as they are physically unchanged, opposed to a cloudy Arctic bombarded with Cyclonic intrusions having changed Sea ice wise.   


The latest North American "Arctic blast"  was influenced by a very small Archipelago cold air vortex,  the Cold Temperature North Pole (in blue),   which grew significantly in size and cooled further over Sub Arctic!  It was  not quite an Arctic blast.  NOAA's satellite 
missed some extent of the boreal forest area cooling in Mid-Quebec,  radiosonde measurements there were in excess of -43 C at 600 mb.  But the rest of the Arctic ocean 600 mb temperatures were more than 20 C warmer.  

The also common saying "the Arctic Cold air" was replaced by advection from the South, "pushed away" by advection.   Not quite so.   Over the Archipelago,  where the coldest air was during Feb 23-26,  the air warmed from a trough of warm air extending itself from a Baffin Bay Low pressure along with and incursion of warmer air from the North!  Originating from the North Atlantic no less. The Archipelago atmosphere primarily warmed literally from above both ways,  from Latitude and altitude.   The correct interpretation of the latest "blast":  the remnant of coldest winter formed greater over the Boreal zone,  it was a Boreal blast!  WD March 6, 2014    

Monday, February 17, 2014

The Polar Jet streams further North


   Let us take 2 known climate records from history,  the very cold winter of 1981-82,  cold either in Europe or North America,  and the very strange winter of 2013-14, cold in some places and warm in some others.  On NOAA climate composite chart on top we can see jet stream largely Southwards compared to January 2014 being largely more jagged  and more to the North.


         Reason for 2014 extreme North Pacific location may have something to  do with North Pacific temperature anomaly and extremely much warmer Arctic Ocean air temperatures.  On a whole the Polar Jet Stream must and did move Northwards as it is overall warmer in 2014 compared to January 1982.  This 2014 pattern gave the strange weather like California drought,  weird cold winter storms in SE US,  massive storms from one strong Cyclone after another hitting and flooding the British Isles and Ireland,   a warmer Olympics even if it is in Sochi.  Finally a much warmer Arctic warmed by the same Cyclones hitting the Isles, and also from Cyclones coming from the North Pacific.  Warmer over all weather means the Jet streams moved North and meandered more steeply, causing unusual patterns creating havoc instead of more predictable weather.  WD February 17 2014...

Friday, February 14, 2014

Great sea ice melt mechanics

~2013 minima results needs be explained
~2014 melt gearing up to be big


Continuous warm anomalies over the Arctic Ocean have been as incredible as the lack of sea ice compaction last summer.  Both result from the same polar vortex wave arrangements, almost  unrelenting like UK storms which flood the Isles and head towards the Pole.  So I am truly not surprised about current low sea ice extent, it was suggested at the time of last minima by the very same cloudy cyclonic coverage which made the minima bigger.  Again the big question is whether sea ice compaction will return come this summer,  if it does,  I can easily foresee a greater melt than 2012.  That is the big if.  Something must ward off these cyclones from hitting the High North so often, particularly the pack ice center.  This something may be El-Nino or more likely a low sea ice extent area of relatively thick ice in the spring. Once the Polar shores are free of ice, a confluence of regularly positioned cyclones may return the Basin Gyre clockwise.  One over Barents and North Pole, the  regular expansive Baffin Bay Cyclone and lastly  over East Siberian Sea.  These 3 will generate an anticyclone covering the remaining Pack ice.  

        Arctic Ocean  shorelines with open water create anchors or stabilizes Cyclones to remain on top of water.   A near persistent Low centering the Arctic Basin, same as last summer, may bring a cold spring .  Ice clogged shoreline areas favor Highs instead of Low pressure cyclones fueled by water.   An earlier than expected shoreline "spring break" of the entire Arctic Ocean sea ice area may change polar patterns though.  Weather patterns rarely remain the same forever,  when they appear to do so,  they set up the new weather system arrangements to come.  


  Search for "Spring Break"  2013;   


      "Spring break" is seen when the entire Arctic Ocean pack gyrates almost uniformly, when it appears to be free from its connection to land,  the best way to see it is with satellite picture animations,  single high resolution satellite pictures do not reveal this event well:

   2007 sea ice looked better than 2013 on the same May date.  But the end result  at minima was different.  


     Although by May 14 2007,  the entire sea ice broke free from shores and rotated clockwise for the first time:

      Using available animation, when the big lead off the Canadian Archipelago coast spanned all the way to the Atlantic,  the entire ice pack was seen rotating on May 14 2007.   It was the beginning of one massive melt of even very thick ice.  


    2013 had a different look, plagued by steady Low pressure cyclones over the Arctic Basin, which killed the usual compaction favoring clockwise movement of sea ice.   By August 2013 the melt was strong but stayed in place, favoring 
a wider over all extent of loose pack ice.     But by mid May 2013 there was no apparent "Spring Break"  until August with available video   from NASA.

   The entire Arctic Ocean ice didn't appear to turn clockwise at all,  it was an anti-compaction melt season.

      There were those who believed 2013 was a "recovery"  from previous torrid melts.  But these suggestions were ignorant about the holistic nature of sea ice.  It was not a recovery at all, but another great melt which didn't move normally. A continuous repeat of the same weather pattern causing this unusual lack of movement is highly unlikely.  But even if it does,  the sea ice will melt just as much but apparently more slowly year by year.  But I'd expect the return of the Arctic basin Gyre because the clouds have created a lower extent of thicker ice, this will allow an earlier spring break. WD Feb14,2014


Friday, February 7, 2014

Circulation GAME CHANGER: El-Nino looms

~Certainty is growing in upcoming El-Nino
~Cloud seeds in the high Arctic starting to show  at 4 degrees above the horizon


     Dr  Masters caught this NOAA statement:

”An increasing number of models suggest the possible onset of El Niño. Strong surface westerly winds in the western Pacific and the slight eastward shift of above-average temperatures in the subsurface western Pacific potentially portend warming in the coming months.”

NOAA may  be referring in part to this:


                These graphs  done by the Earth & Space Research  Institute acknowledge a sea current output (in blue) which usually precedes the sea surface temperature trend.   As the top graph demonstrates,  ENSO sst's 
will rise soon.   


        In the high Arctic,  I have recently observed higher than troposphere dark cloud streaks above the horizon,  they showed 4 degrees above the horizon on most days, and closely reflect the same equatorial Pacific sst trend,  what needs be observed is higher than 4 degrees horizon clouds:  


    March 2010  El-Nino was already fading ,  High Arctic persistent stratospheric streaks reached 10 degrees above the horizon.  


  zoomed  October 2010 stratospheric black cloud streaks mixed with some bright ones,  these coincided with the end of El-Nino of 2010,  these streaks were as high as 5 degrees above the horizon.   Presently 4 degrees was seen many times.  


              Confidence is High ,  El-Nino is likely returning this year,  the Global Circulation will change accordingly,  this will affect sea ice melt of 2014 in 2 ways; 1 there will be more clouds,  and 2 the persistent Arctic cyclonic presence of summer of 2013,  the pattern making it so may be changed.    WD Feb7, 2014

Thursday, January 30, 2014

TWIN CTNP's winter's much smaller coldest grip

~Weakens winter were it should be strongest
~Creates smaller atmospheric mesoscale regions susceptible to migrate along the real polar vortex waves.  

Again not an Arctic blast affected some parts down South,  because the temperature anomaly chart makes the Arctic +5 to +20 C above normal:
Courtesy NOAA
   While in Atlanta 2" of snow turned to ice paralyzed the great Southern city,
historically not a frequent event. There seems to be a disconnect between a warmer Arctic and regionally small extreme cold weather.  The concept most TV weather spoke persons never talk about is the concept of isolated coldest atmospheres affecting regions not accustomed.  There are 2 at present,  one in Siberia, the other over North Eastern North America, both have weaker winds at 250 mb Center.

Courtesy NOOA
    The jet stream usually sits next to where the coldest atmosphere exists, if the size of the coldest air extent diminishes the jet bends more and is less expanded towards the equator.    CTNP's in black rotate counterclockwise.
       
       The bigger Cold temperature North Pole cell is over Siberia, which injects cold air west of the Urals.    The  North American Cell is way smaller and will not last.
It gradually diminished over quite some time,  being well South of its usual location demolished its strength and area, unfortunately to the detriment of people not use to snow.  The North Pole,  still in darkness  is quite warm despite the presence of a high pressure immediately next to it.  The dual CTNP nature will evolve further, likely being prominent in Russia, not so over North America.  Along with this change comes the different weather and essentially warmer temperatures.  WDJan30, 2014

Sunday, January 12, 2014

Count the calories, Arctic sea ice needs a heat diet.

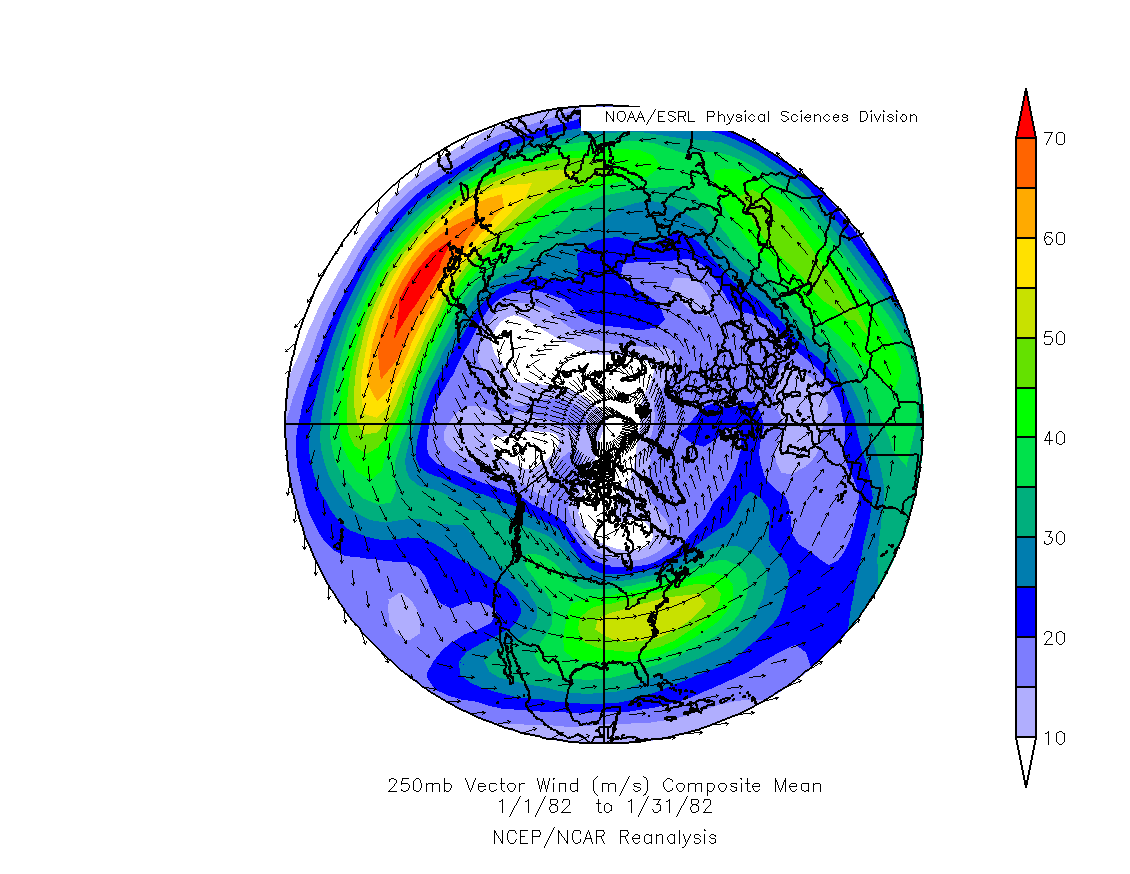
Looking back,  at December 1981 when the Arctic Ocean sea ice was much thicker,  we can see the outline of this vastly thicker sea ice with Outgoing Long wave Radiation (left):

     NOAA recalculation to the right shows the outline of older multiyear ice for December 2013.   Here is proof in the effects of sea ice thickness on climate.  In December1981 there was far less radiation escaping to space compared to 2013.  Roughly 20 watts/m2.  

     This necessarily means thinner ice has an impact in profound ways,  the buildup of winter,  how big it becomes,  how long it lasts,  depends on how cold the Arctic and Sub-Arctic surface areas become.   A prolonged cold period permeating a huge area of the Earth defines the winter bitter, too long,  miserable.   From the onset of a greater sea ice melt at minima, the world wide dark season becomes automatically warmer, shorter, less expansive,  even with ideal conditions of thermal radiation cooling to space,  the thinner than multi-year new ice warms the atmosphere,  not only by thermal radiation from the sea,  but because of its fragile state,  creating more leads,  venting moisture and gases to the atmosphere throughout the winter, as opposed to a period called spring "break up", when vast amounts of organic and inorganic gases, naturally trapped under the ocean for many months,  gets unleashed with great amounts of water vapour,  at about Mid-April onwards,  when lower clouds and ice crystals overtook the sky.   This eruption from the sea protected sea ice further by reflecting resurgent sun rays to space.  For about a decade, this happened a lot less,  while during these last 10 years or so the process of all winter venting did the opposite,  it clouds the Arctic further during the dark season,  deflecting radiation usually heading to space back to the sea ice.  The OLR chart is worse than it seems,  a lot more  of thermal radiation returns to surface. Thus from darkness a warmer Arctic is seen on historic charts.


  Translation in temperature terms
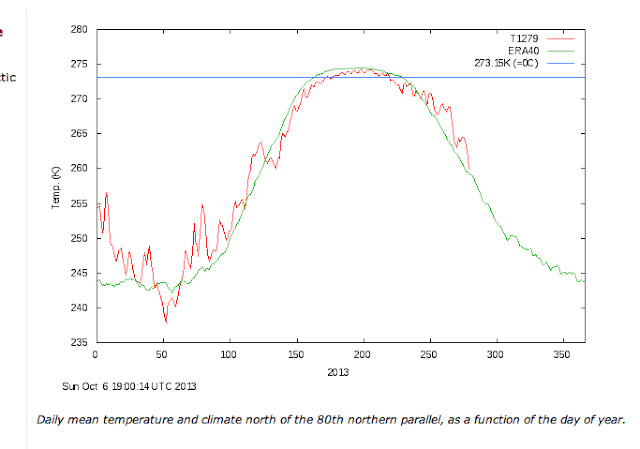
The larger dark blue average temperature  covering the Arctic Ocean was about 242.5 K, or -31 C.
That is the average temperature of sea ice surface for December 1981.
 We have seen that thick ice has its own thermal imprint seen all the way to space,  it emits a lesser heat signature keeping the underlying sea cooler all year round.  A key feature of Polar biology is how not diverse it is, how encroachment from southern species reveal this fact.  At the core of this unique desert like feature is a steady predictable colder than not air temperature,  rarely having great variances aside from the impacts of large cyclone incursions.   A great change in temperature affects everything and everyone:
 
The larger light blue for December 2013 is a mean temperature at about 247.5 K a full 5 degrees Centigrade above 1981.
The main obvious question to ask is how this temperature increase affect  the entire Arctic?     The immediate weather related answer is that there are lesser or weaker thermal inversions at the surface to air interface.  These inversions are complex,  but heat essentially renders them more scarce,  this has huge implications with Anticyclone Genesis.  What makes a High Pressure is descending air spreading outwards to a Cyclone.  During the Long sunless Polar regions this air circulation favors a cooling process,   air skims the risen to surface permafrost and it cools on its way to the Cyclones.   Very cold air has much more stable properties than warmer,  the cooler air has long shed its moisture , giving a negative feedback,  the air freezes further by radiation escaping to space  decreasing temperatures further. Multiple thermal layer layers are created one on top of each other,  the coldest in bottom warming above.
Like the "Jupiter refraction bands"  seen breaking up the sun disk at sunset:


     March 31 2004,  very cold ground triggered isothermal boundary layers are seen  breaking up the sun disk even to bend along with them diagonally.  The sunset on
top of the hill captured a magnificent green flash,  along with bent layering features.


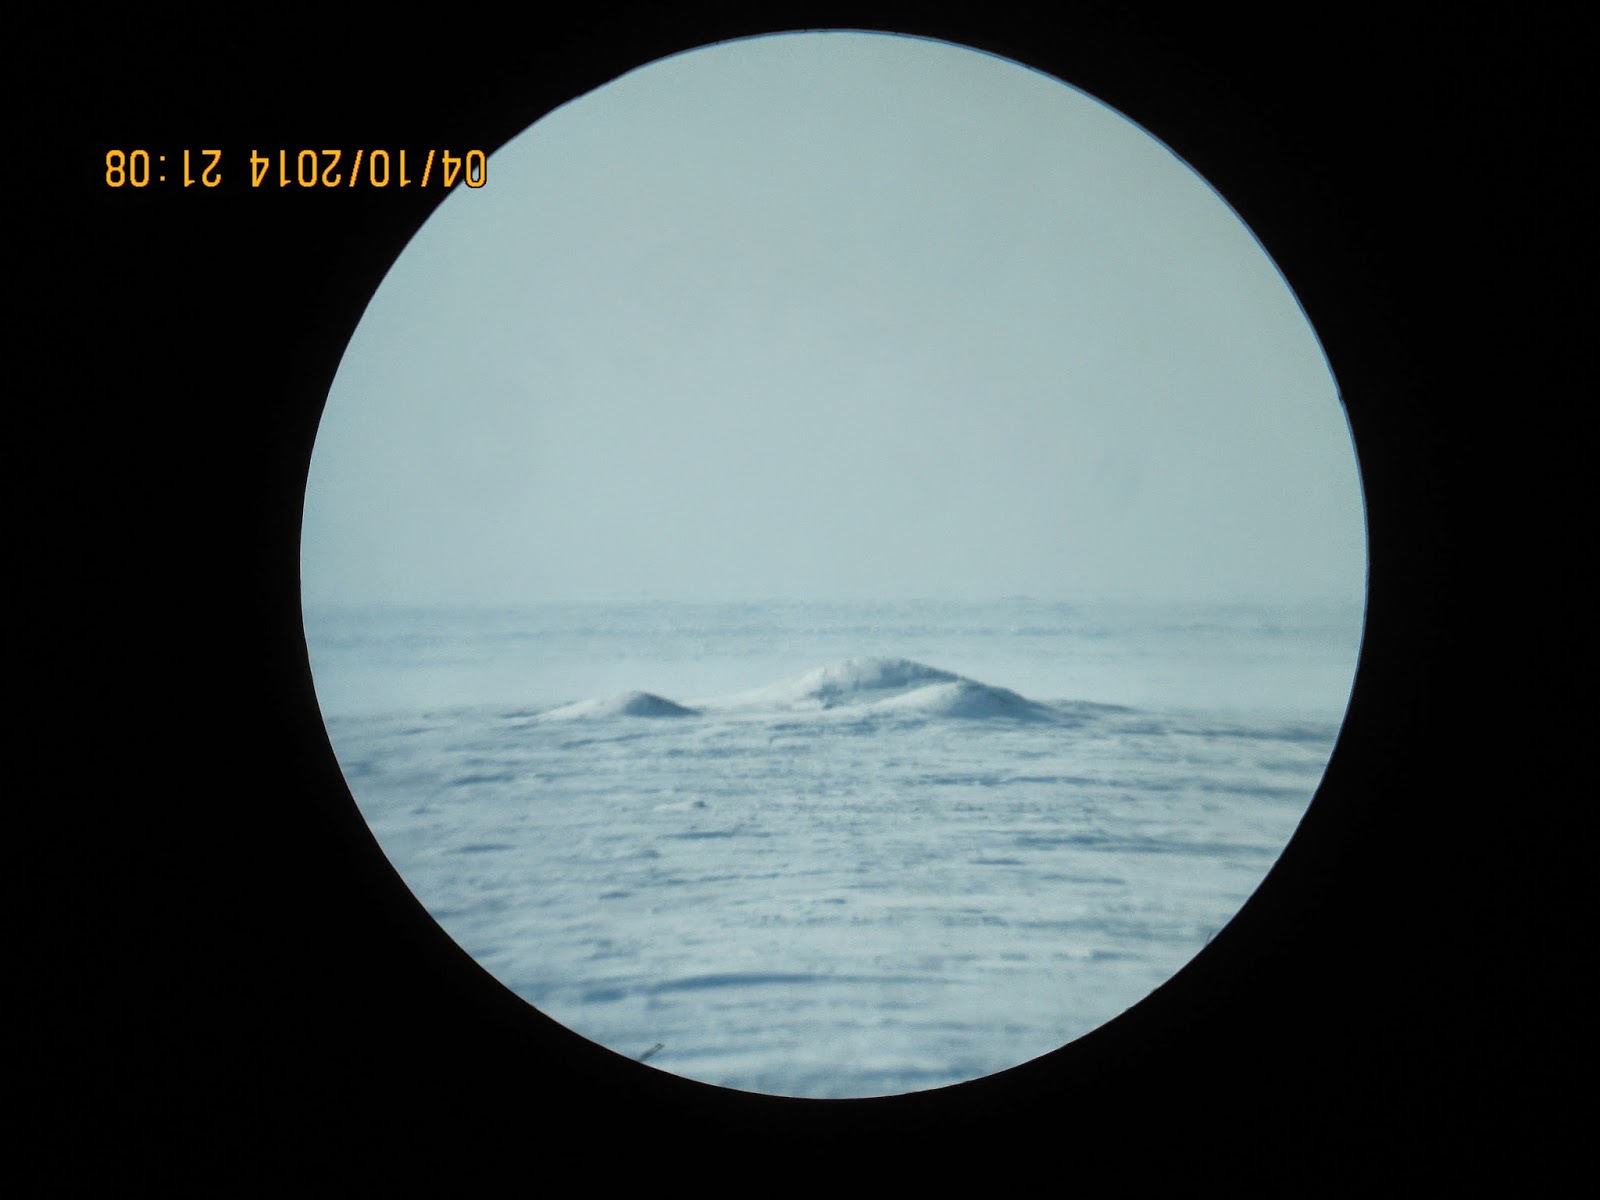
     Although distortions caused by by boundary layers still persist,  as this March 24 2012 demonstrates.  However, sunsets are gradually moving Southwards,  the sun is seen more rounder southern like earlier in the year,   the effect of thinner ice is also seen by the shifting horizon as well.  This awaits another presentation.


Warming off the ground changes the sunset,  the sun looks rounder, the layering vanishes.   Land and seas capable once of fostering great anticyclones transform to cyclone bearing zones.  April 28, 2013.

     Isothermal layering on a grand scale fosters High pressure systems.  During Polar winters these systems cool the Earth a great deal.  If the Cyclogenesis system balance continues to change,  like during current reduction of disappearance of sea ice as of current days,  winter has no other way but to shrink in size, and be more wild and variable temperature wise because what is left of the cold air zone moves around with the rotation of the Earth.  WD January 11, 2013


Monday, January 6, 2014

Current North American "Polar Vortex" media definition not quite accurate

Wikipedia definition:

"A polar vortex (also known as mignogno cyclonespolar vorticesArctic cyclonessub-polar cyclones, and the circumpolar whirl) is a persistent, large-scale cyclone located near one or both of a planet's geographical poles. "   

      Well  the North Pole is not in Minnesota USA.   Unless there was a huge geographical shift.  

   More correct is the following definition still from Wikipedia:  

"The Arctic vortex has two centres, one near Baffin Island and the other over northeast Siberia.[2] In the southern hemisphere, it tends to be located near the edge of the Ross ice shelf near 160 west longitude.[3]When the polar vortex is strong, the Westerlies increase in strength"

     So the current US weather is not a polar vortex,  but something rather more exotic,  more a propos to a lesser worldwide winter days when the jet stream gyrates weirder than usual,  it has more to do with the snow laden ground night sky being clear and the day time with fewer sun hours,  it is the Cold Temperature North Pole   (CTNP) .

    Definition of CTNP:   Center of the coldest place on Earth.  It is usually one area emerging from a synergistic effect which is the culmination of the lost of heat to space,  it is not North or South Pole Centric.  But may have secondary,  isolated spots.  The circulation around a CTNP is counterclockwise.
By definition a Cyclone at center often without clouds.    Its location is calculated by the equivalent temperature of the entire temperature of the troposphere, or the Density Weighted Temperature.     In lack of actual DWT charts we must contend with 600 mb charts which often mathematically represent the temperature of the entire atmosphere,  since 600 mb charts are not often published,  either 500 or 700 mb charts may be used.   In this example
a US 700 mb map,  the center of the  2nd coldest measured atmosphere in the world is over Illinois!   @ -33.6 C #2 CTNP.    Ust-Barguzin Siberia has the coldest  # 1 CTNP cell at -34.9 C.   

        While the Wikipedia  cited Baffin Island "vortex "  is CTNP3   #3 coldest.        CTNP's further to the South do not last long,   disappear rather quickly.   While Arctic CTNP's last longest,  sometimes months.       But the reason why central North America is cold today was because a few days ago there was another CTNP over Southern Quebec,  which drew colder air southwards to its West.  Warmer air and cyclones were drawn in to its North .    The Southern Quebec CTNP warmed substantially and is well over Newfoundland on 6 January 2014.   WD 6 Jan 2014.   


Sunday, October 6, 2013

CLOUDS major play; explains a cool 2013 Arctic summer and warm Arctic fall.

~ENSO split NORTH SOUTH  bipolar personality, south Atlantic hurricane killer

~Global Warming may not be explained in simple terms, one must study to reveal never ending natural variations,  where they may be and why they exist.

     As written below,   the cool Canadian Arctic summer was a complex contribution by 2 major atmospheric players, anti beaufort gyre contrarian winds caused by near persistent presence of cyclones over the Arctic Ocean,  and extensive cloud coverage,  of which were even present over rather large Arctic High Pressure systems which did happen more often lately.

  The great Arctic cloud coverage of 2013 must come from extraordinary reasons,  the -extra-   is of course ENSO but there was an 'ordinary';  the North Atlantic and Pacific, look carefully at the last 4 months,  El-Nino loomed like North of the equator,  La-Nina was just South:

Virtually the same SST image every day for 4 months.  Thanks NOAA...


  One reason why there were fewer or no hurricanes in the South Atlantic,  but lots of thyphoons in the Pacific was and is that the Northern Hemisphere is in El-Nino mode.  While the Southern Pacific is very much like a La-Nina.  ENSO has a split personality syndrome.  Furthermore the North Pacific is unusually warm.  The cloud seeds are planting continuously,  therefore clouds under a high pressure regions are possible.


Conversely a cool Arctic summer,  can't contribute to a cool following fall, not logical isn't it?  However, the clouds persist.  Giving naturally a much warmer fall:

   DMI nice North of 80  Graph says it all.  The clouds are keeping the Arctic fall warmer.  wd October 6,2013